
Cover photo by Desire Darling.
Find the Queen Malachite in the FBIS database (Freshwater Biodiversity Information System) here.
Family Synlestidae
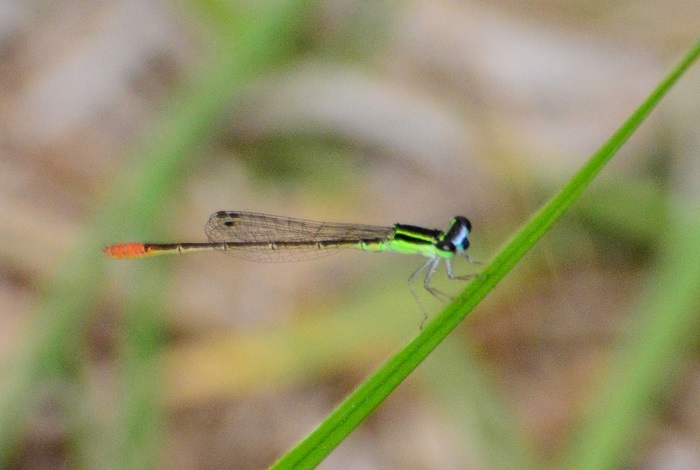
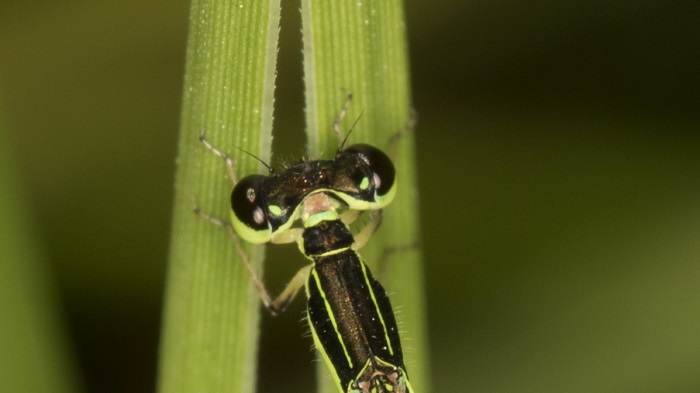
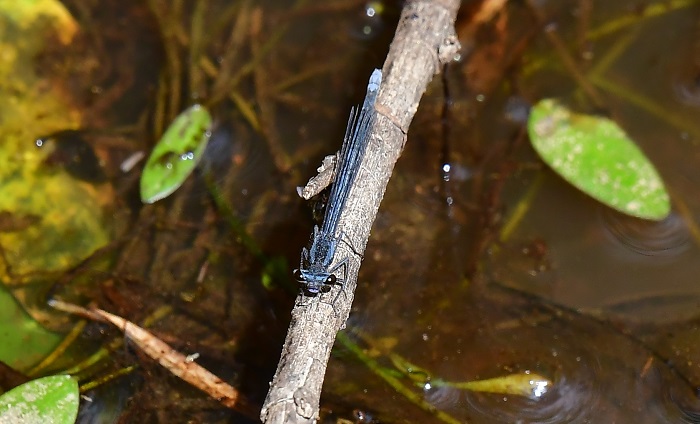
Identification
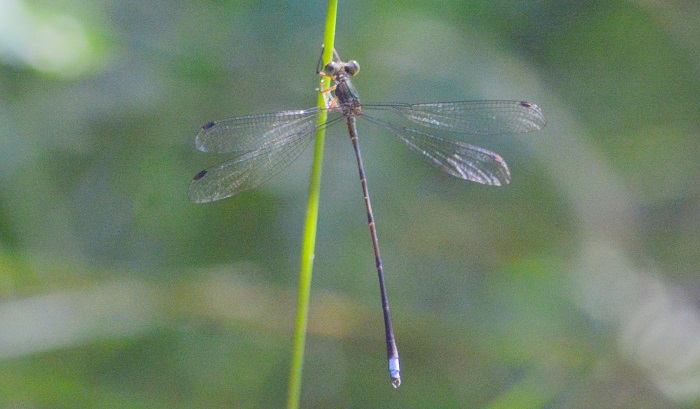
Storms River, Eastern Cape
Photo by Gregg Darling
Large size
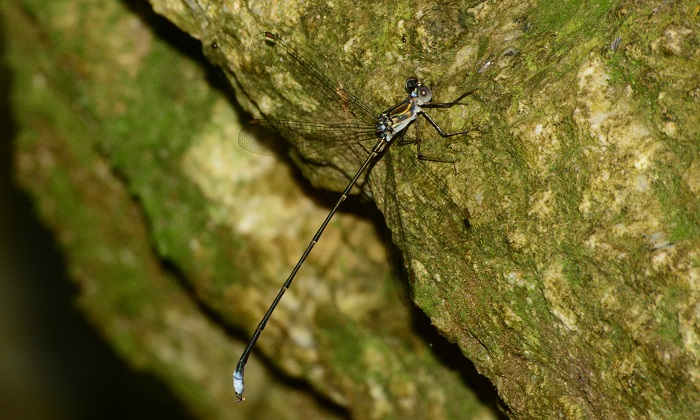
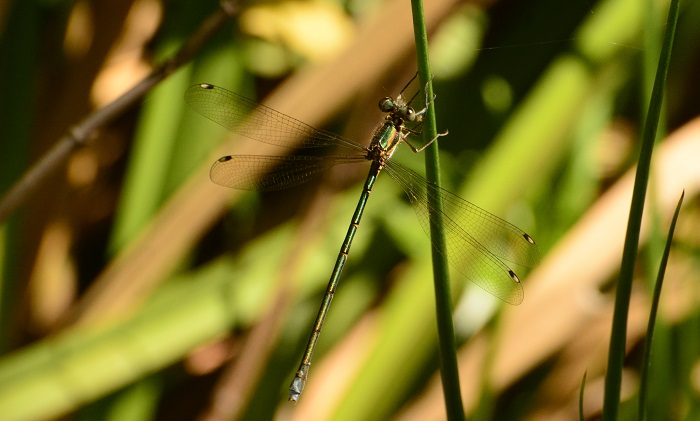
Length up to 55mm; Wingspan attains 61mm.
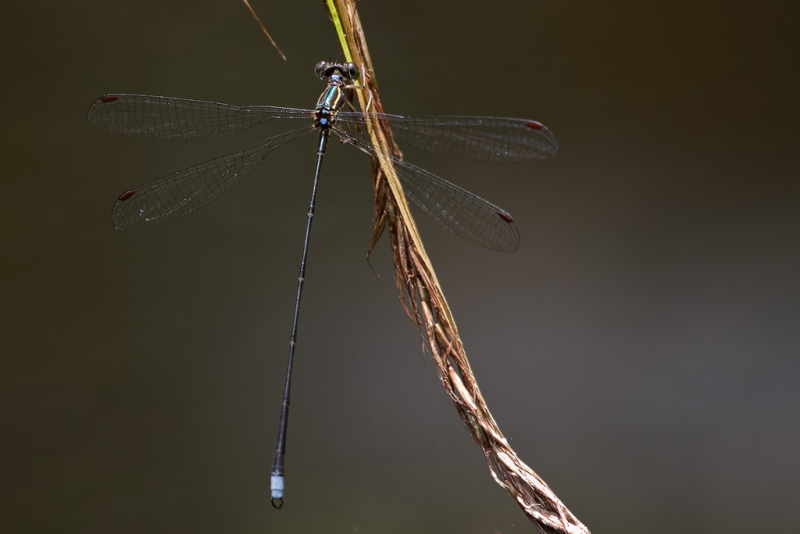
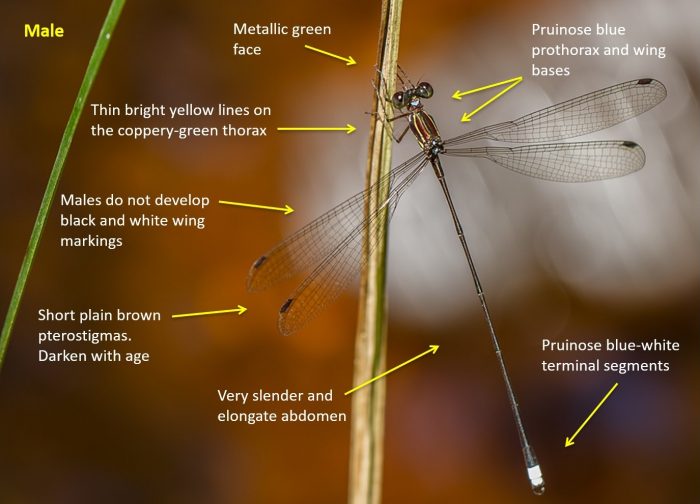
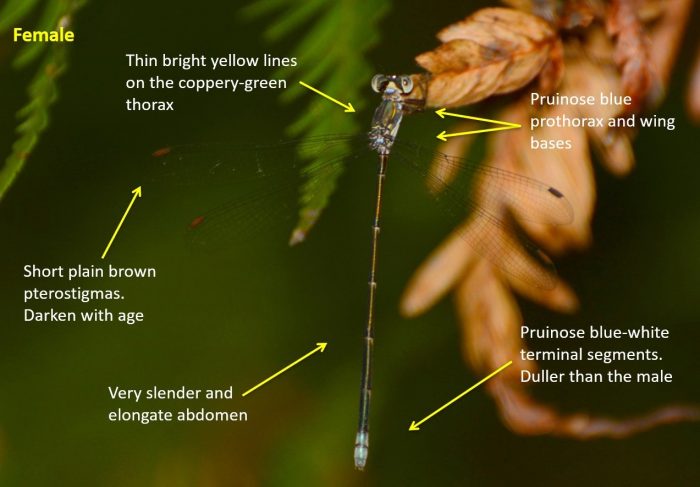
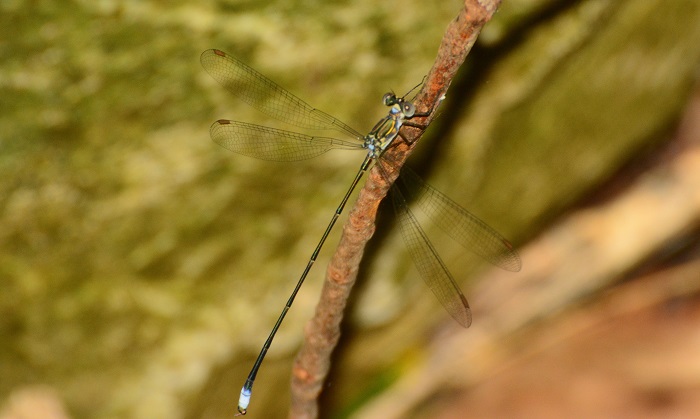
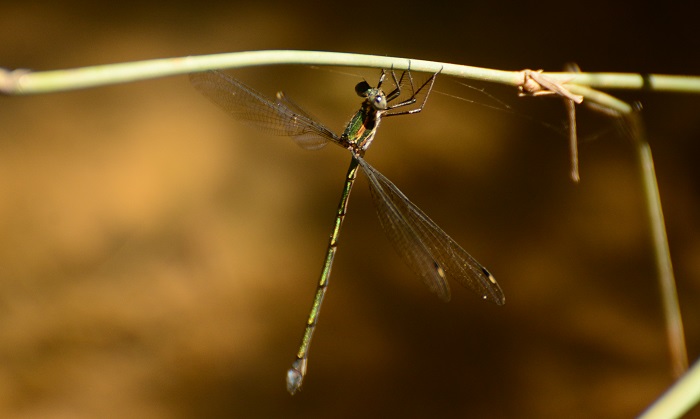
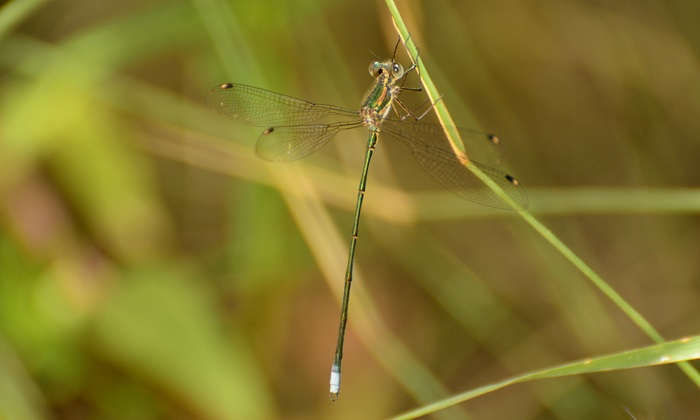
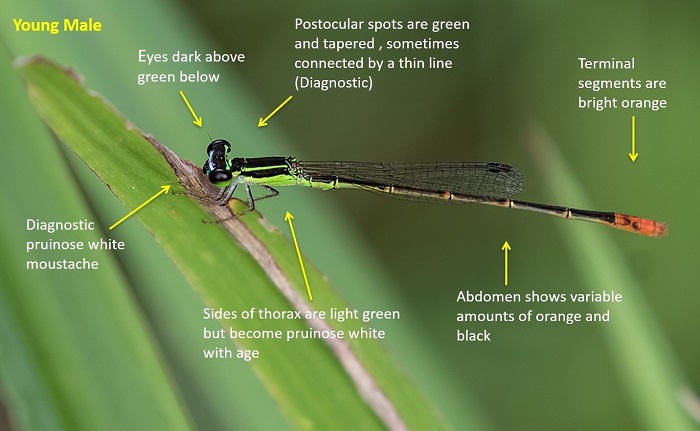
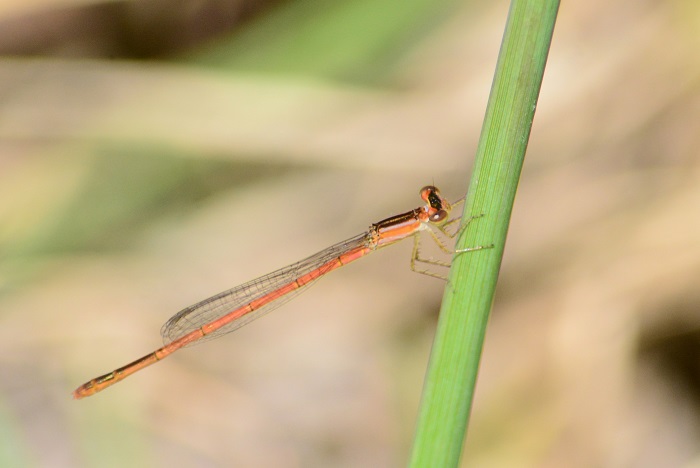
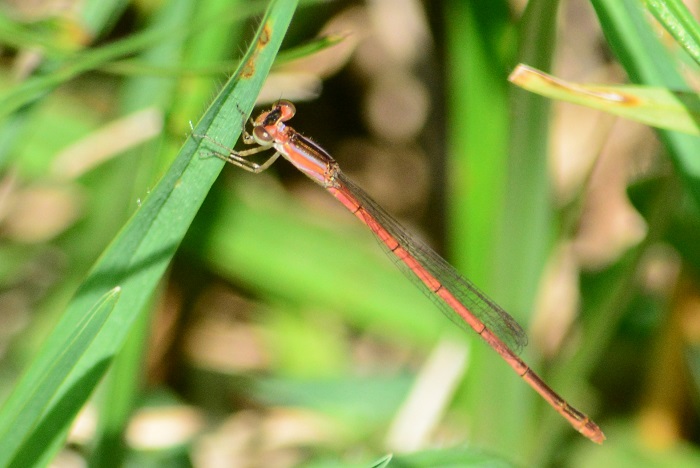
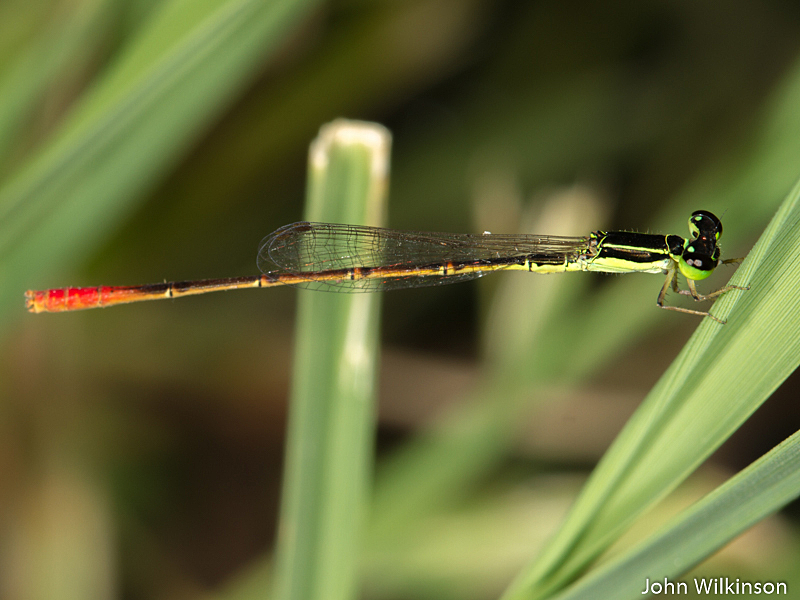
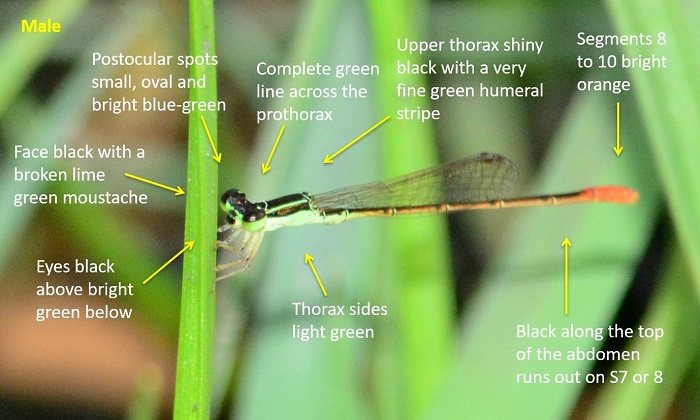
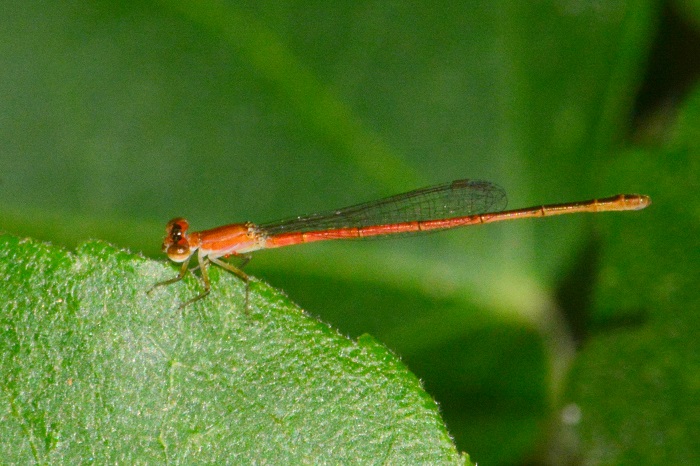
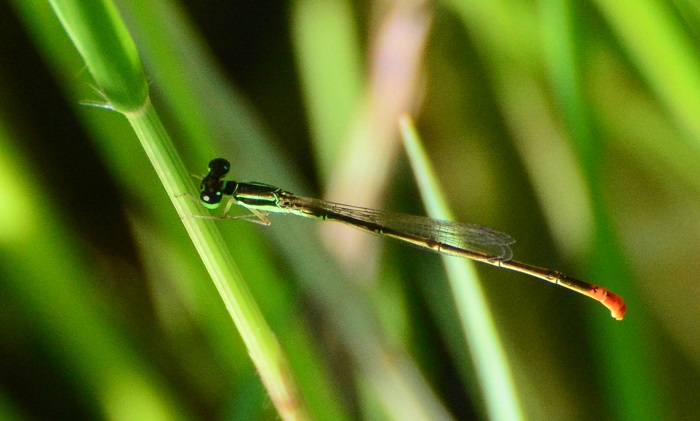
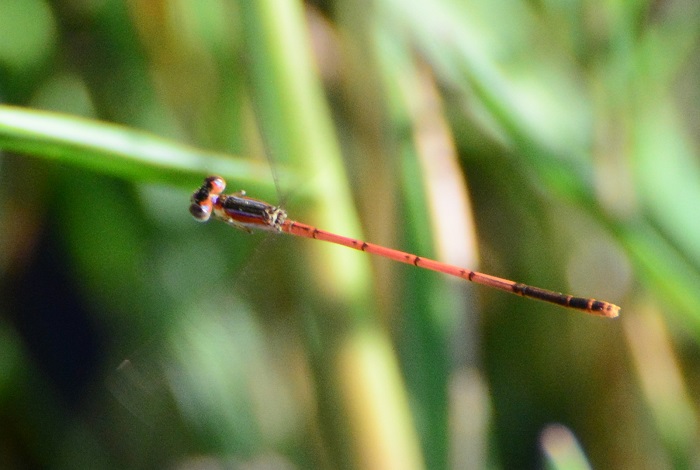
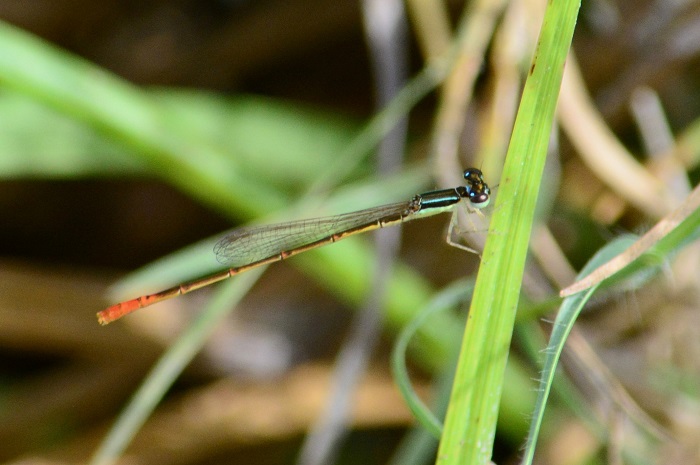
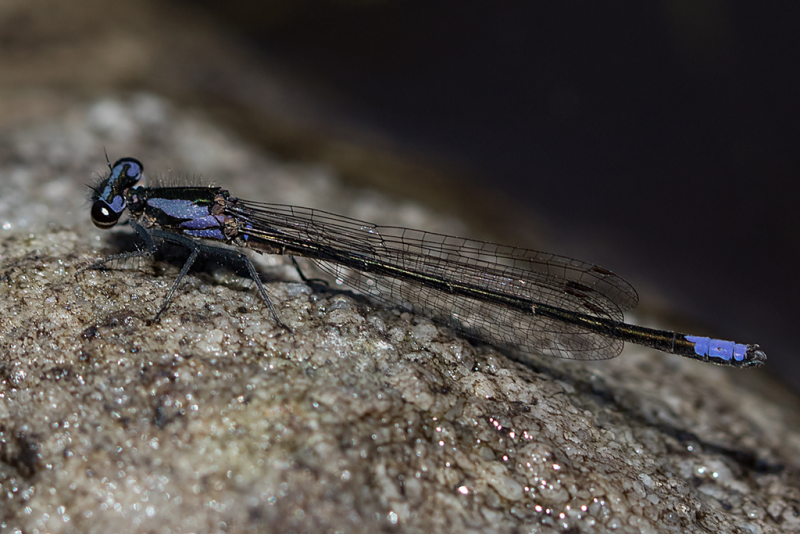
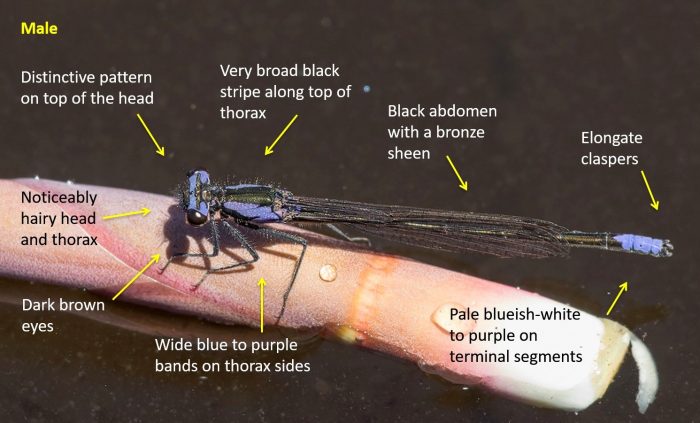
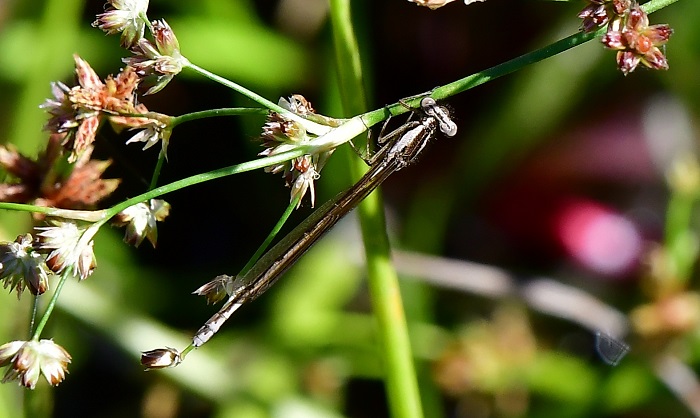
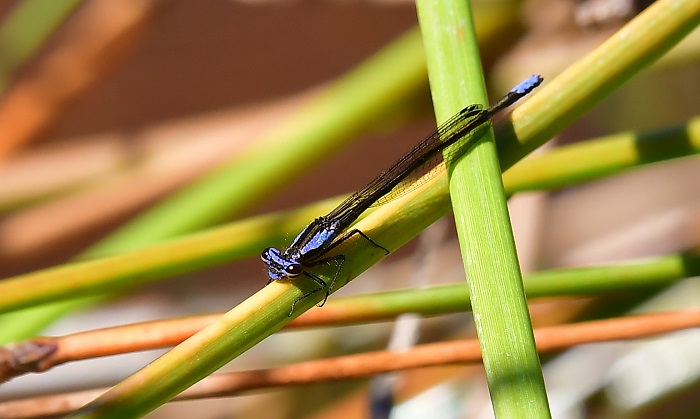
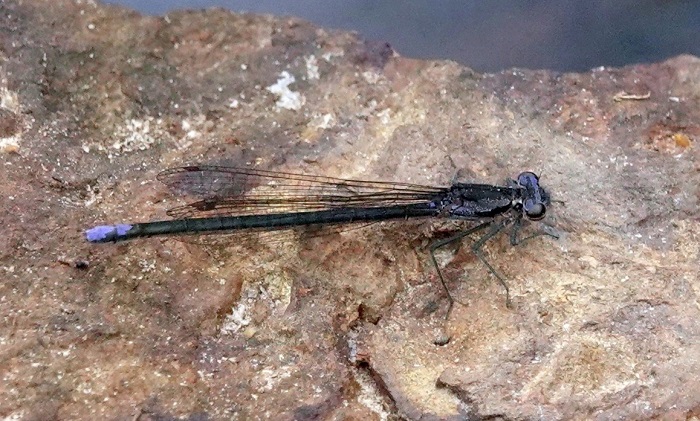
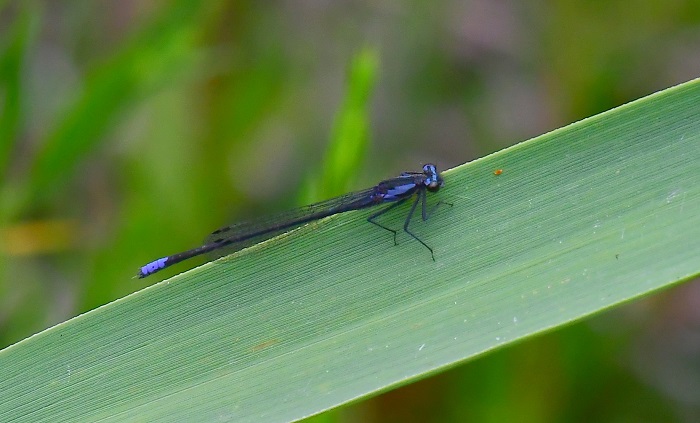
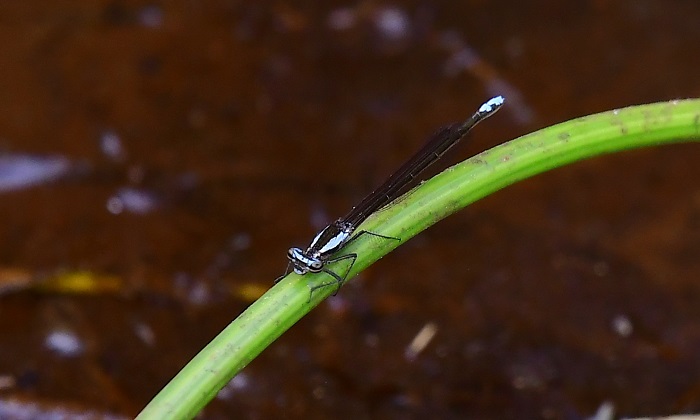
The sexes are similar. Adults are dull metallic green when young turning slightly bronzy with age. They have a distinct pale blue-grey pruinescent ‘collar’ on the neck and two blue-grey spots between the wings. The face is dark metallic green with yellow markings. The thorax is dull metallic green becoming bronze-brown with age. The abdomen is dark brownish-green with a pale, narrow ring at the start of each segment. Females are duller and lack the dark metallic green face of the males. Females also have a broader abdomen and are not as elongated in appearance.
Marloth Nature Reserve, Western Cape
Photo by Ryan Tippett
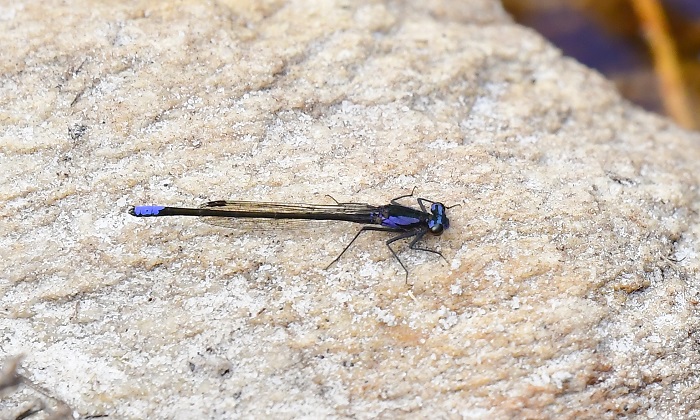
Within its restricted habitat and distribution, the Queen Malachite is only likely to be mistaken for an un-banded male Forest Malachite (Chlorolestes tessellatus) or non-pruinose White Malachite (Chlorolestes umbratus). The Queen Malachite is similar in size to Chlorolestes tessellatus but is more slender in appearance. The Queen Malachite can be further differentiated by having short, plain pterostigmas (not bi-coloured), and a pruinose blue collar (prothorax) and wing bases. Readily differentiated from male Chlorolestes umbratus, as that species is noticeably smaller and lacks the pruinose blue prothorax and wing bases.
The Queen Malachite is not known to co-occur with the closely related Rock Malachite (Ecchlorolestes peringueyi).
Click here fore more details on identification.
Habitat
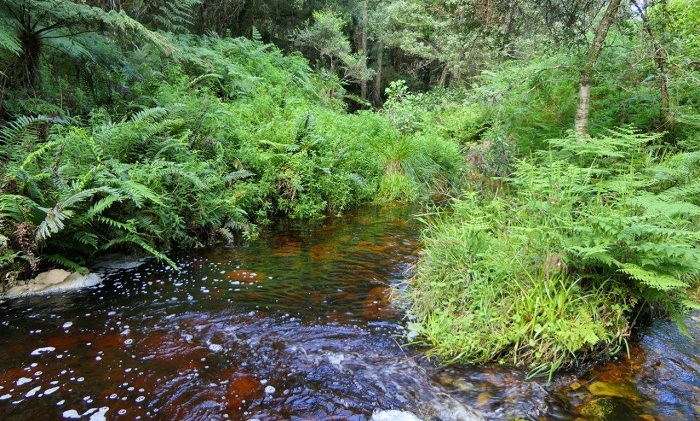
Photo by Sharon Stanton
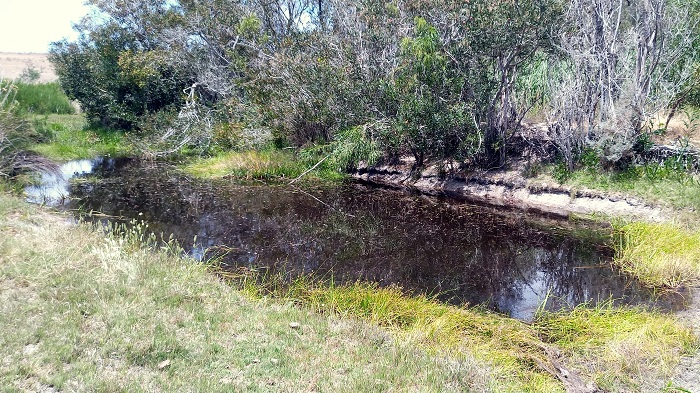
The Queen Malachite has rather specific habitat needs. It inhabits closed-canopy indigenous forests, where it is found along shady, fern-lined streams. Requires clear, flowing water with pools and a rich growth of stream-side plants. The Queen Malachite is often found where there are large, moss-covered rocks and boulders. It is found from sea level up to altitudes of around 500m.
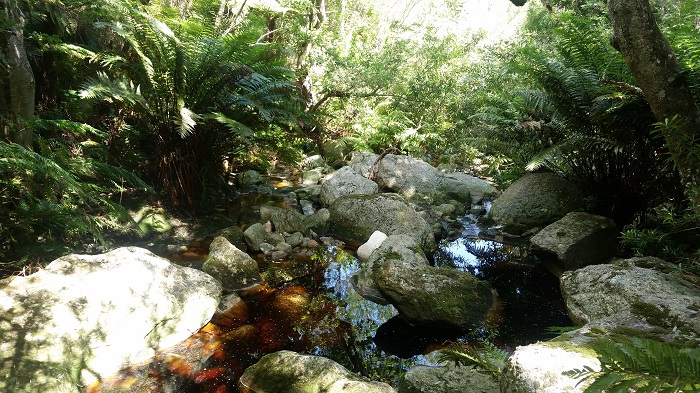
Photo by Ryan Tippett
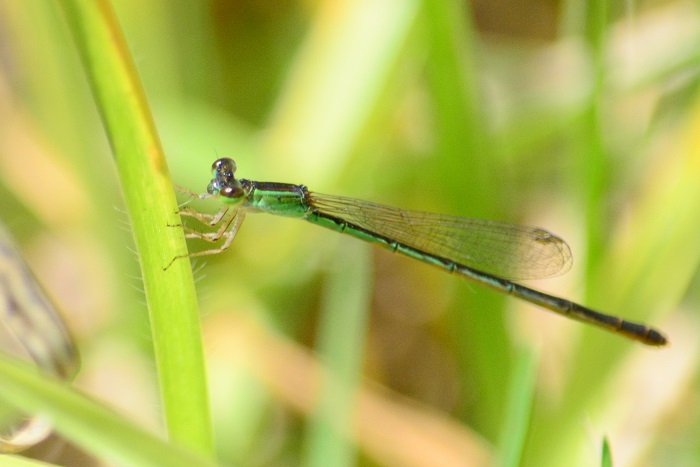
Behaviour
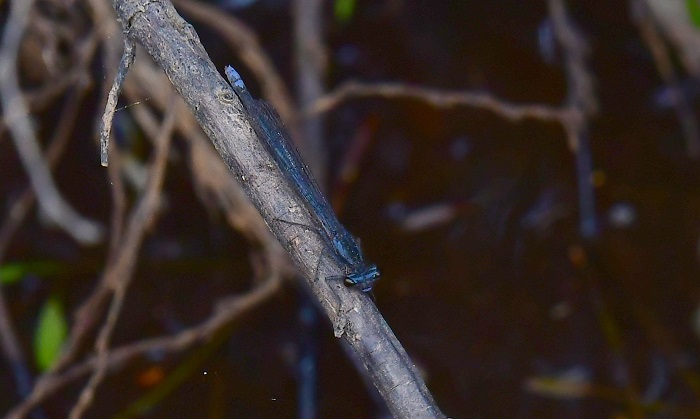
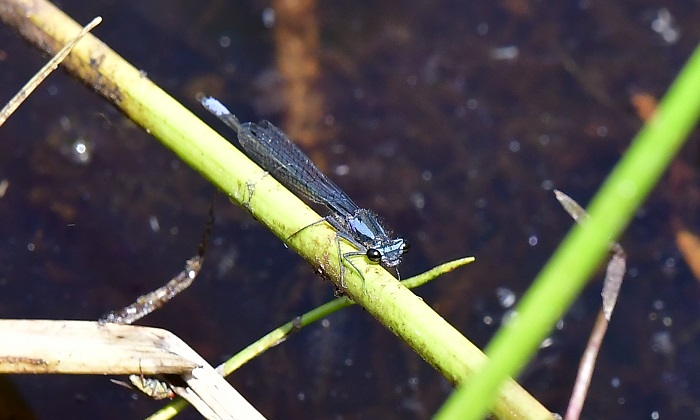
Ecchlorolestes nylephtha is a shade-loving species. It is unobtrusive and easily overlooked, spending long periods at rest. The Queen Malachite is most often seen hanging vertically from a perch over the water with wings outstretched. They also frequently perch on the side of large streamside boulders. Both sexes occur in the same area but females are even less conspicuous.
Queen Malachites are most active from November to May (see Phenology below).
Marloth Nature Reserve, Western Cape
Photo by Ryan Tippett
Status and Conservation
The Queen Malachite is a common but highly localised endemic. Listed as Near Threatened in the IUCN Red List of Threatened Species. The loss of its natural forest habitat is a potential threat to the species, but populations are currently thought to be stable. The Queen Malachite is only known from pristine habitats and is unlikely to tolerate habitat degradation.

Marloth Nature Reserve, Western Cape
Photo by Ryan Tippett
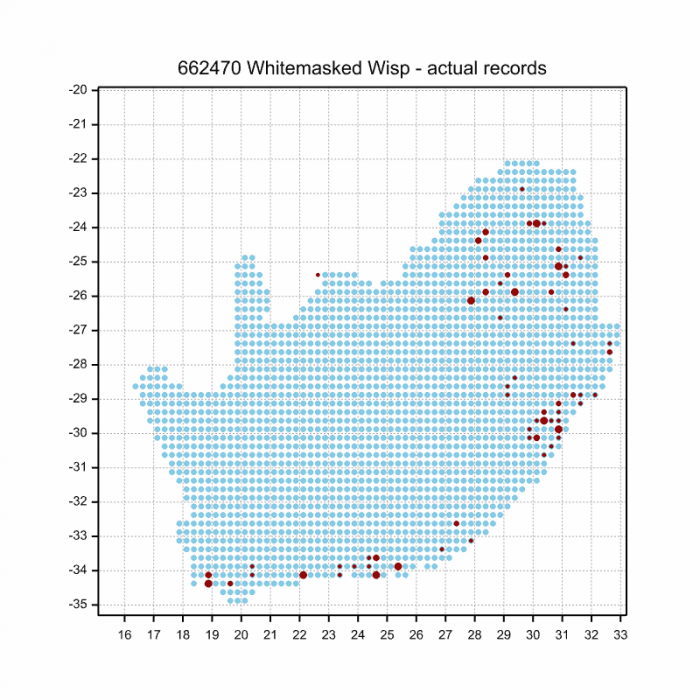
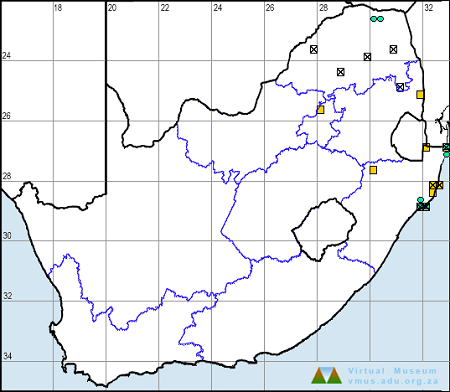
Distribution
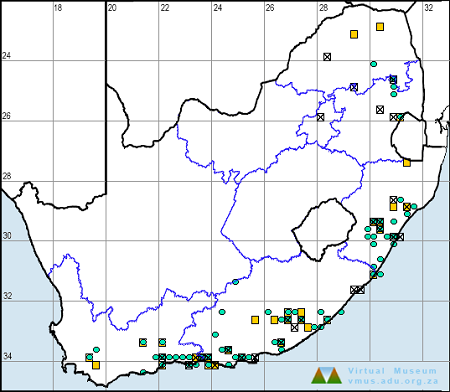
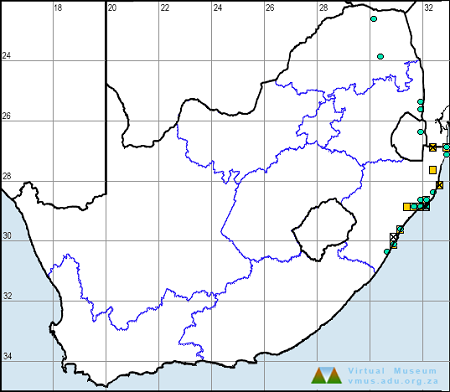
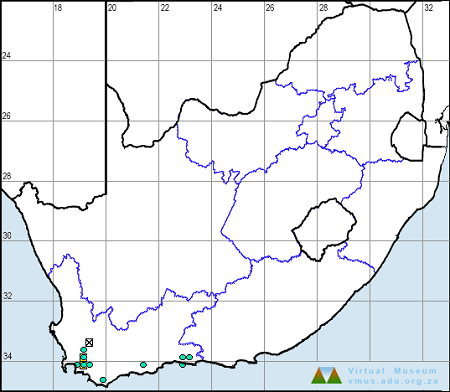
The Queen Malachite is endemic to South Africa, where it is known only from the Eastern and Western Cape provinces. Its distribution extends from near Swellendam in the west to near Kareedouw at the easternmost point in its range.
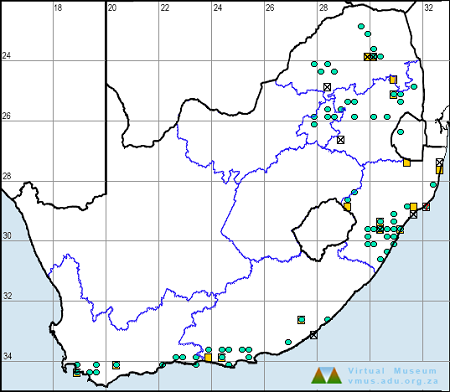
Below is a map showing the distribution of records for Queen Malachite in the OdonataMAP database as at February 2020.
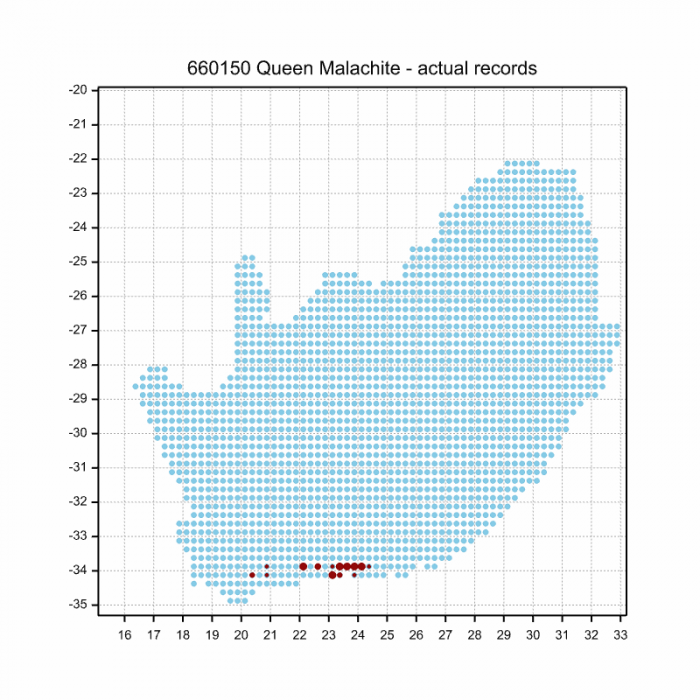
Below is a map showing the distribution of records for Queen Malachite in the OdonataMAP database as at December 2024.
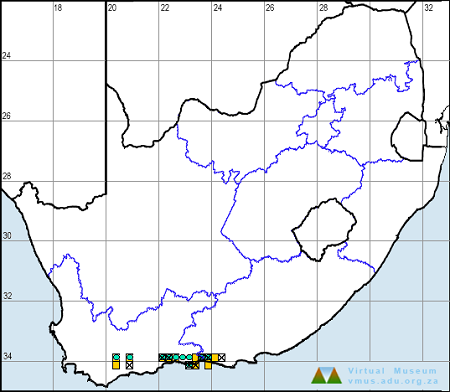
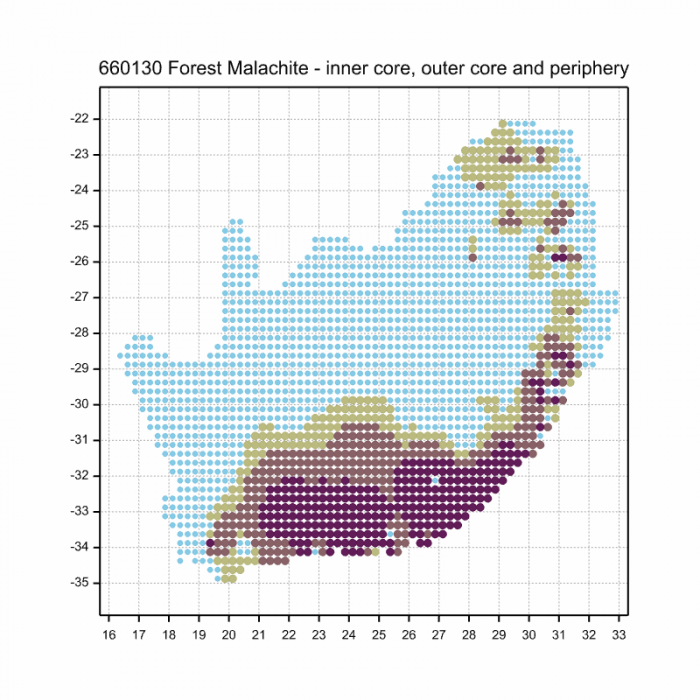
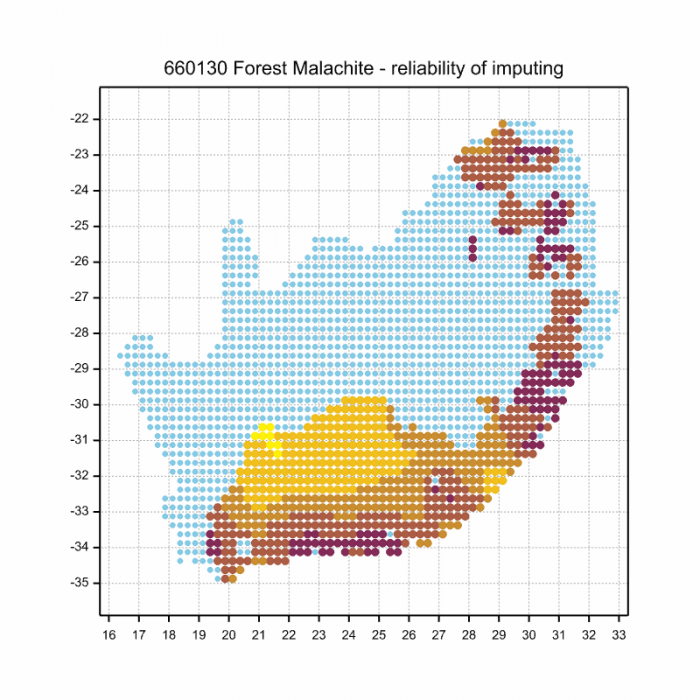
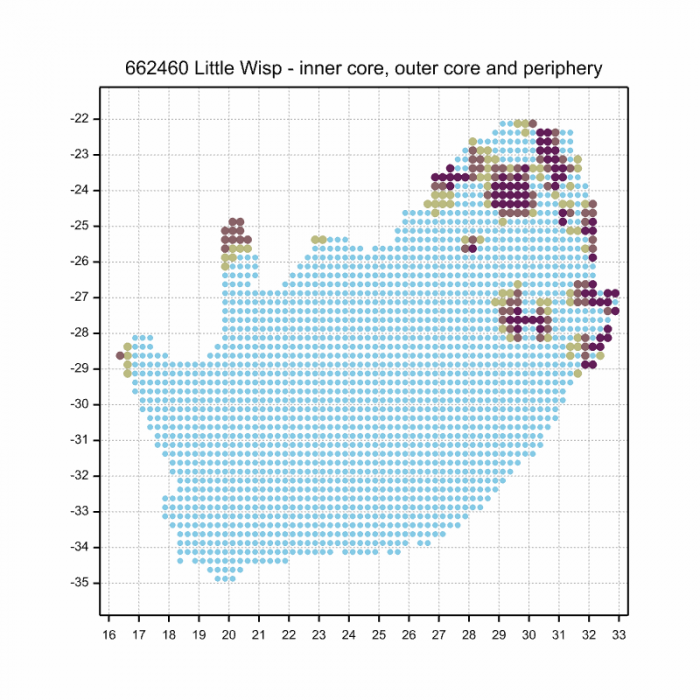
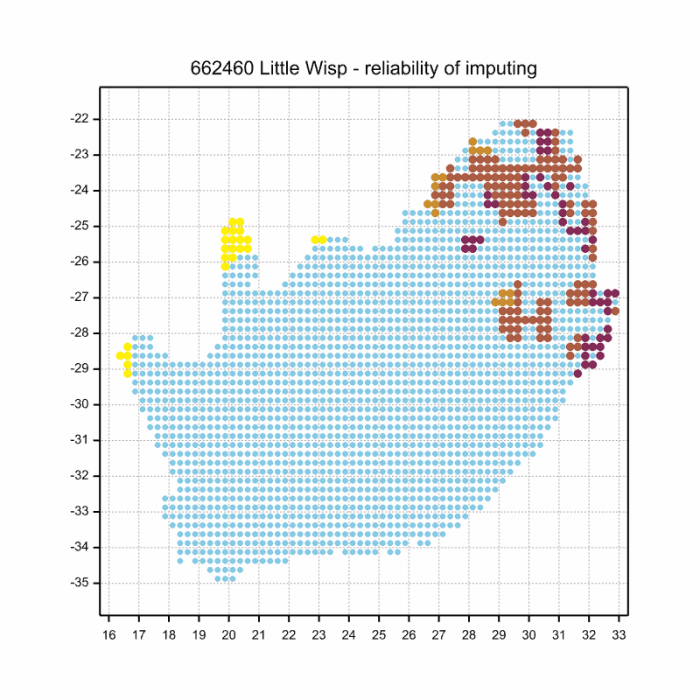
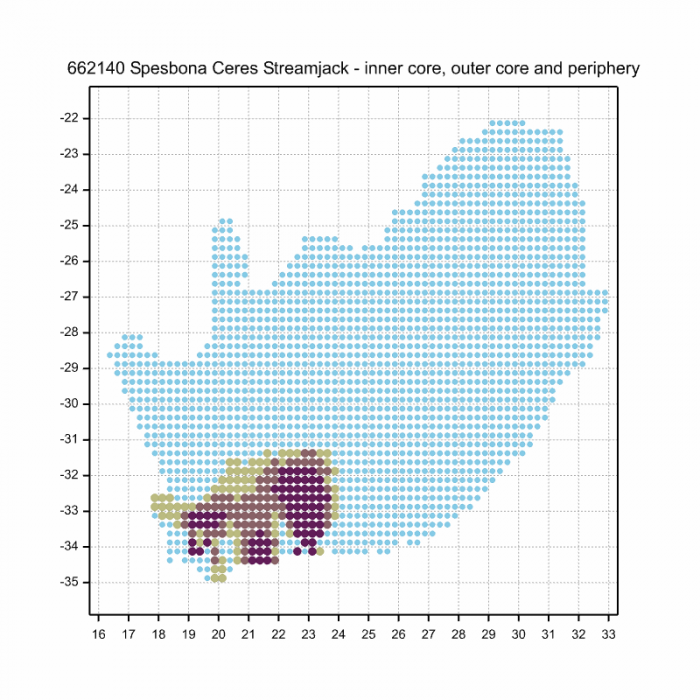
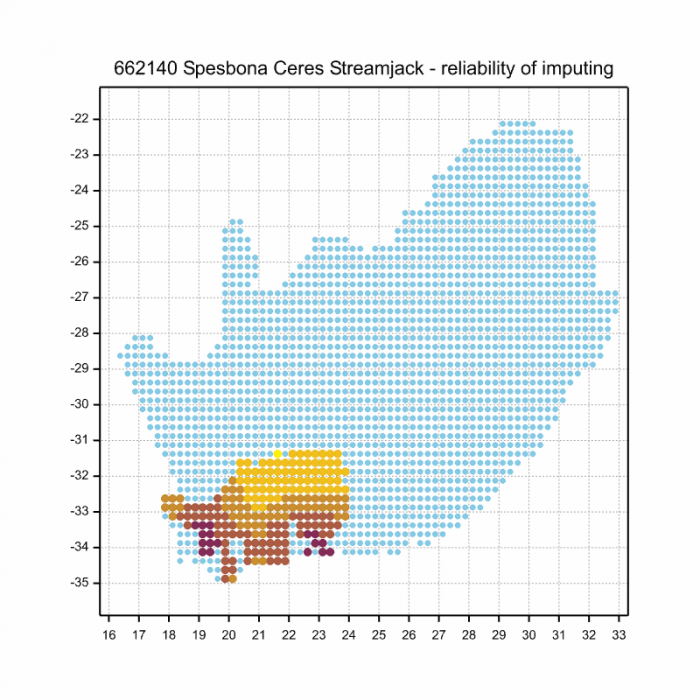
The next map below is an imputed map, produced by an interpolation algorithm, which attempts to generate a full distribution map from the partial information in the map above. This map will be improved by the submission of records to the OdonataMAP section of the Virtual Museum.
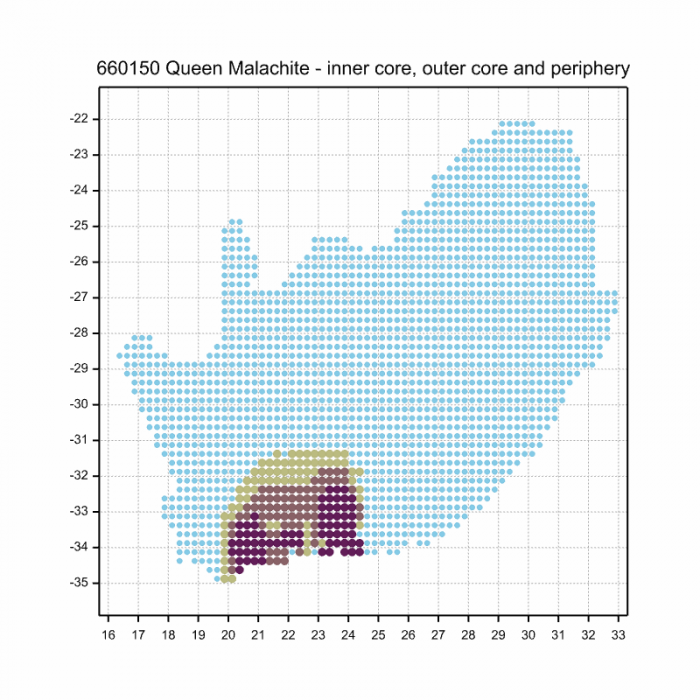
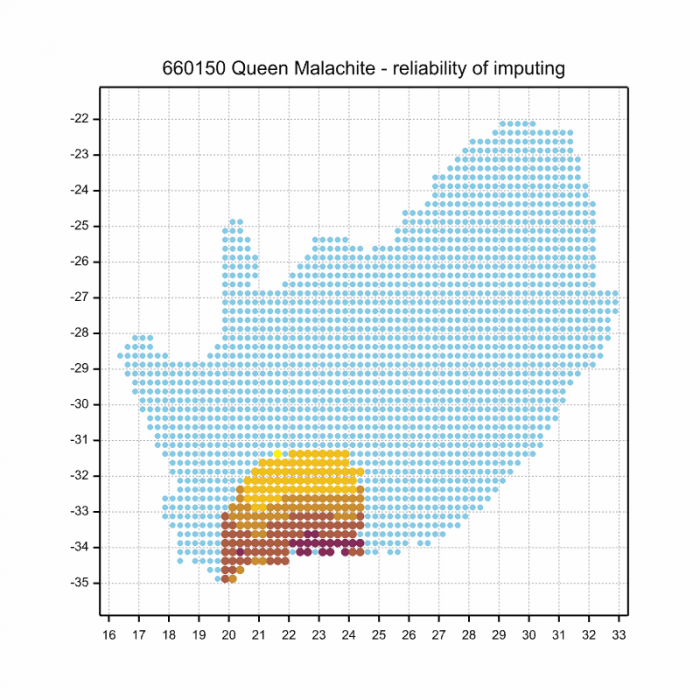
Ultimately, we will produce a series of maps for all the odonata species in the region. The current algorithm is a new algorithm. The objective is mainly to produce “smoothed” maps that could go into a field guide for odonata. This basic version of the algorithm (as mapped above) does not make use of “explanatory variables” (e.g. altitude, terrain roughness, presence of freshwater — we will be producing maps that take these variables into account soon). Currently, it only makes use of the OdonataMAP records for the species being mapped, as well as all the other records of all other species. The basic maps are “optimistic” and will generally show ranges to be larger than what they probably are.
These maps use the data in the OdonataMAP section of the Virtual Museum, and also the database assembled by the previous JRS funded project, which was led by Professor Michael Samways and Dr KD Dijkstra.
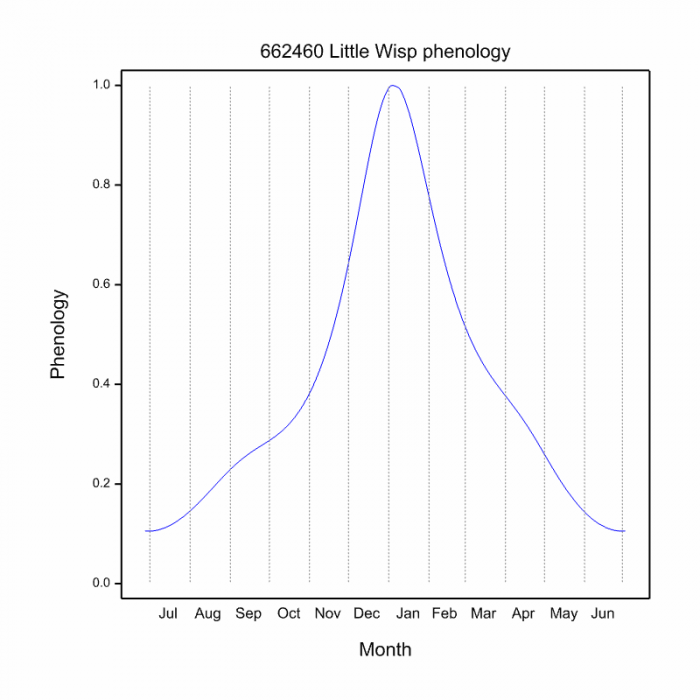
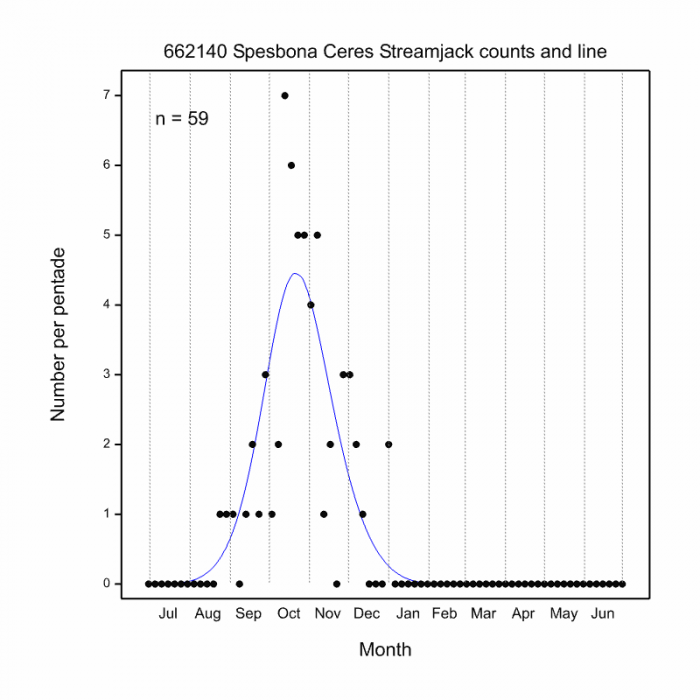
Phenology
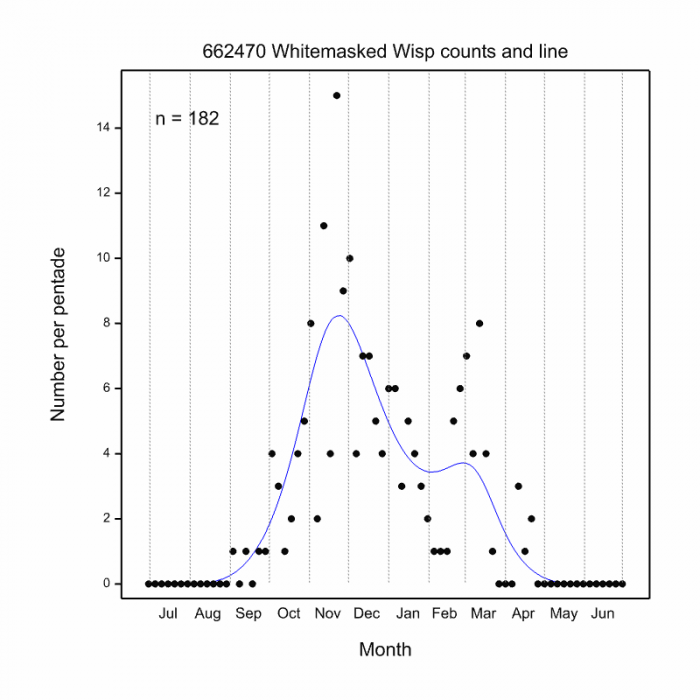
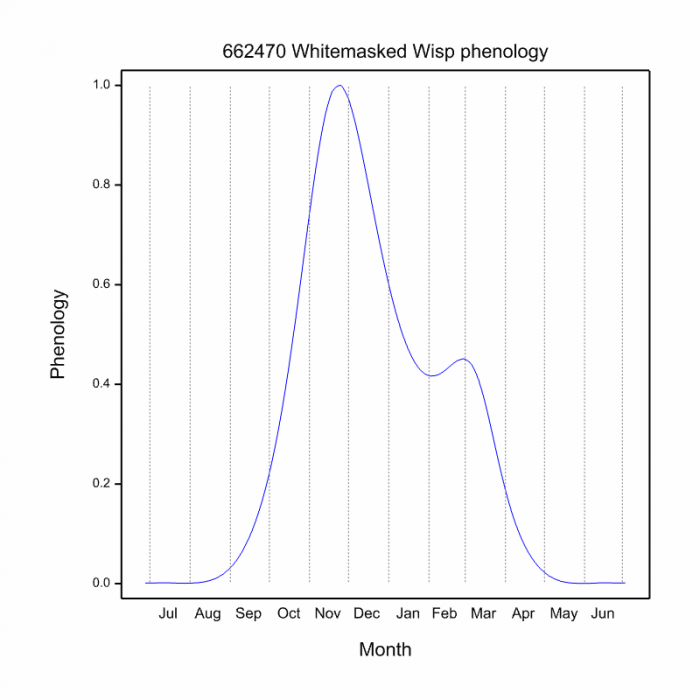
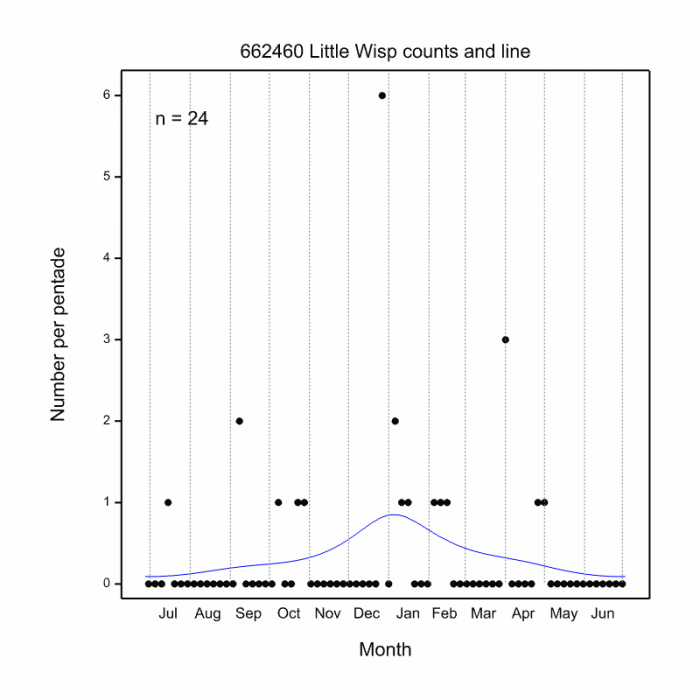
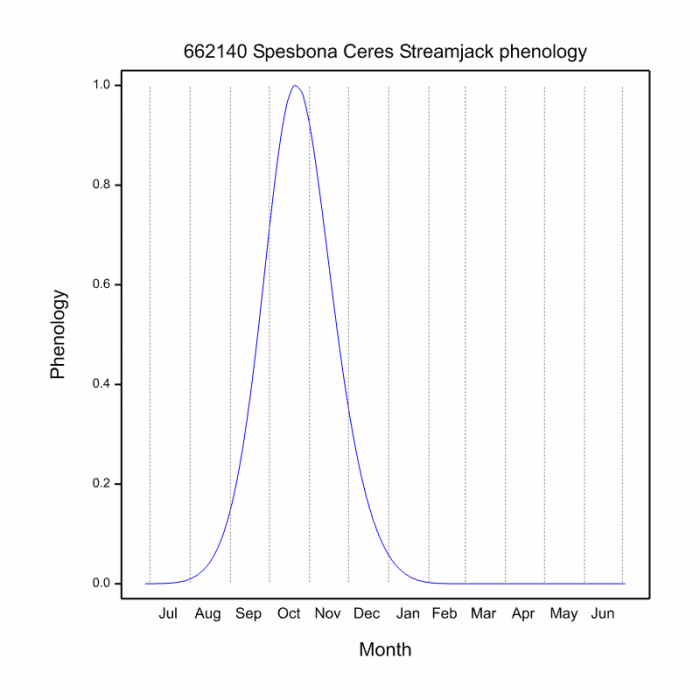
The next two graphs shows how the occurrence of the Queen Malachite varies within the year, i.e. the phenology. There are 79 records in the database for this species, so these results ought to be starting to be fairly reliable. The first plot shows the number of records in each pentade, five-day periods, which start on 1 July and end on 30 June of the following year. Two pentades have the maximum number of records, six; they are in January and April. There are records in every month of the year, except August and September. The blue line is generated by a smoother, an algorithm which aims to separate the “signal” from the “noise”, and shows the pattern of seasonality for this species. The second plot shows only the blue line, and it is scaled to lie between zero and one, for easy comparison between species.

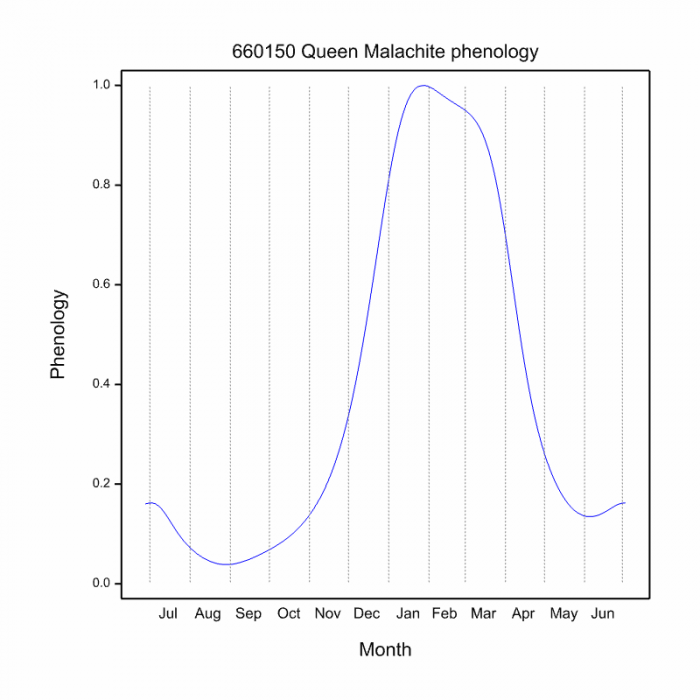
The phenology plot shows a long flight period for the Queen Malachite, with a peak in observations From January to March. There seems to be a steady increase in abundance from October to November, and relatively rapid decline in April.
The quality of the phenology can be improved by actively searching for this species throughout the year. The August-September gap needs to be confirmed by getting lots more records in other months of the year. Although 78 records seem to provide a plausible phenology plot, additional records of Queen Malachites are needed in OdonataMAP to make it really reliable. If you have access to a locality where it occurs, the ideal would be to make a record in OdonataMAP for each five-day period in which they are seen and photographed.
Marloth Nature Reserve, Western Cape
Photo by Ryan Tippett
Further Resources
The use of photographs by Desire Darling, Gregg Darling, and Sharon Stanton is acknowledged.
Queen Malachite Ecchlorolestes nylephtha (Tillyard, 1917)
Other common names: Koninginmalagiet (Afrikaans).
Recommended citation format: Loftie-Eaton M; Navarro R; Tippett RM; Underhill L. 2025. Queen Malachite Ecchlorolestes nylephtha. Biodiversity and Development Institute. Available online at https://thebdi.org/2020/04/23/queen-malachite-ecchlorolestes-nylephtha/
References: Tarboton, M; Tarboton, W. (2019). A Guide to the Dragonflies & Damselflies of South Africa. Struik Nature.
Samways, MJ. (2008). Dragonflies and Damselflies of South Africa. Pensoft
Samways, MJ. (2016). Manual of Freshwater Assessment for South Africa: Dragonfly Biotic Index.Suricata 2. South African National Biodiversity Institute, Pretoria


