It was a great privilege to be part of the team teaching at a course for the Tropical Biology Association in Nairobi during April. The course was called “Analysing and interpreting citizen science data.”The Tropical Biology Association (TBA) is making a fantastic contribution to capacity building for biodiversity conservation in Africa and southeastern Asia. The impact of the TBA is awesome, and browsing its website is an inspiration. It punches way above its size. The TBA has helped launch the careers of more than 2,000 conservation champions. My Nigerian PhD students have talked to me enthusiastically about the TBA courses they participated in. For example, Dr Zingfa Wala, who did a four-week TBA course in Madagascar, says: “The TBA course is the one that had the most impact in my career. It exposed me to practical and hands-on experimental design. It was my first experience working with a team and it opened up great networking opportunities.”
An indication that the TBA had identified a genuine need is the fact that more than 200 people applied, 10 times more than could be accommodated. The 22 participants who were selected came from 10 African countries: Liberia, Benin, Nigeria, Cameroon, Congo, Uganda, Kenya, Rwanda, Tanzania and Botswana. We gathered at the National Museums of Kenya on Monday 8 April for a week-long course that started at 8 am each morning and finished at 5 pm.
Two sets of numbers from 1 to 11 were placed on the tables, and each participant had to find the other person with the same number, and introduce that person. Clara Cassell from Liberia got paired with Judith Mirembe from Uganda. Judith told us that Clara does yoga, and Clara told us that Judith plays hockey. Judith is also leader of Uganda Woman Birders and was recently featured by the Audubon Society: https://www.audubon.org/news/when-women-run-bird-world.
The main thrust of the course was the analysis of the data collected through citizen science projects. Dr Rosie Trevelyan, who heads up the TBA, facilitated many discussions. This is the output from a session in which we discussed the challenges of doing citizen science in Africa.
The participants were taken step-by-step through the basics of R, developing the skills needed to produce maps of their own countries in R. This part of the course was led by Dr Simon Gillings, of the British Trust for Ornithology. Here he is describing some of the outputs from the citizen science projects he is responsible for, dealing with birds in the UK.
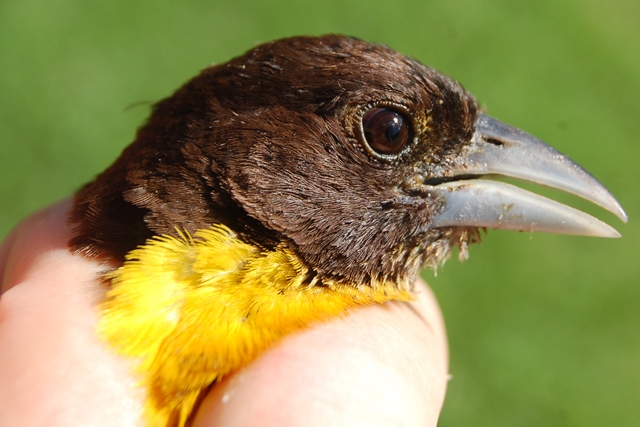
My own contribution to the week consisted of six presentations. This slide illustrates how ideas about the distribution of the Amethyst Sunbird chopped and changed. The truth emerged in 1997 as a result of the distribution map generated by citizen scientists in the first bird atlas. This is the map in the bottom right hand corner of the slide.
There were visiting lecturers. One was David Clarence, who is professionally an econometrician, and an enthusiastic contributor to the bird atlas project in Kenya. He has applied his statistical skills to the Kenyan bird atlas data, and he described to us the huge strides he has made in the analysis.
During the course, there was lots of time allocated to working on the datasets the participants had brought with them. This enabled them to get help when stuck.
We spent one morning in the Nairobi City Park. In part it was a great excuse to get outside and in the sun, but more importantly it was an opportunity to test protocols for collecting data. City Park is an excellent resource for this kind of activity. This Blotched Leopard Lachnoptera ayresii was the first record for the species in LepiMAP, the Atlas of African Lepidoptera, for the grid cell (0136BD) into which Nairobi falls (see http://vmus.adu.org.za/?vm=LepiMAP-678745). Here is the map of the Nairobi grid cell (City Park is in the north-centre of the grid cell) and list of species for the Nairobi grid cell http://vmus.adu.org.za/vm_locus_map.php?vm=lepimap&locus=0136BD. Currently that list has 68 species.
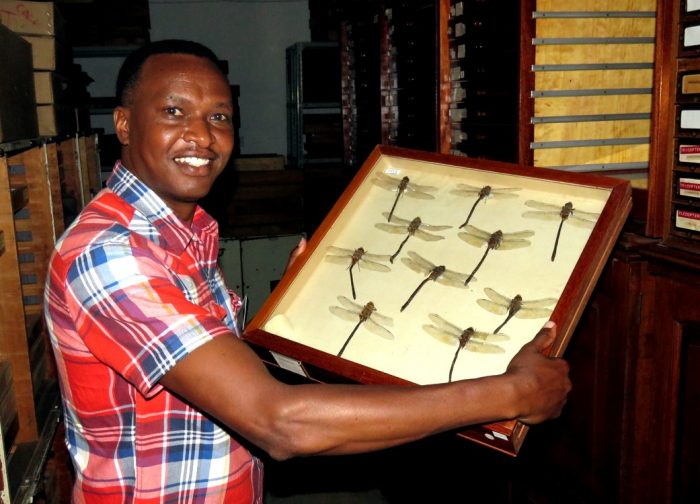
Quite a large part of the museum precinct is natural vegetation. After the classes one day a group of participants found this horned chameleon. It got submitted to ReptileMAP (http://vmus.adu.org.za/?vm=ReptileMAP-170398) and was identified as Jackson’s Chameleon Trioceros jacksoni. One of the participants on the course was Laban Njoroge, who is the entomologist at the museum. The museum’s collection of insects was on the same floor as our course venue, so Laban had the shortest distance between his office and the course! In the course WhatsApp group, Laban told us about the Jackson whose name is attached to this chameleon: “This man Jackson was a seasoned and passionate naturalist. In one of the AGMs of the then East African Natural History Society (now Nature Kenya, Nature Uganda and Nature Tanzania) he came up with an idea of making natural history collections. To kick start his idea he donated a drawer of butterflies. This is how the huge insect collection at National Museums of Kenya was started. This drawer still remains in our collection to date.”
Laban took me on a tour of the insect collection he curates. Since Jackson’s time, the National Museums of Kenya’s collection has grown to more than three million specimens. Here is Laban showing me the Black Emperors Anax tristis in the collection. This is Africa’s largest dragonfly, with a wingspan of about 13 cm. This is also one of Africa’s largest and most valuable insect collections.
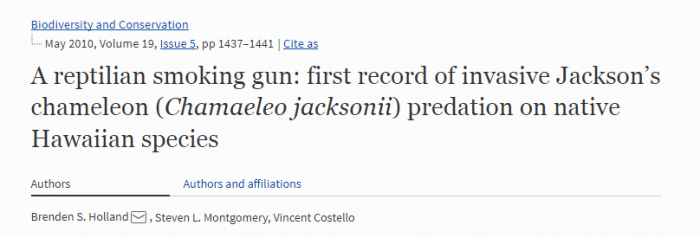
Back to Jackson’s Chameleon! It is astonishing that an animal like a chameleon can become a problematic invasive alien when introduced elsewhere. Chameleons form part of the pet trade, and some Jackson’s Chameleons were released in Hawaii. Here is part of the abstract of the paper in the journal Biodiversity and Conservation featured above: “Native Hawaiian invertebrates, including four individuals of an endangered species, were discovered in the dissected stomachs of wild caught Jackson’s Chameleons collected from June to November 2009 on the island of Oahu, Hawaii. Jackson’s Chameleons were introduced to the Hawaiian Islands in the early 1970s. Of particular concern is the fact that introduced chameleons have previously only rarely been found in native Hawaiian habitat. One concern is that Jacksons’s Chameleons may be undergoing a range expansion into upper elevation pristine forests. If they reach and establish populations in these areas, devastating impacts to the native ecosystem are possible.”
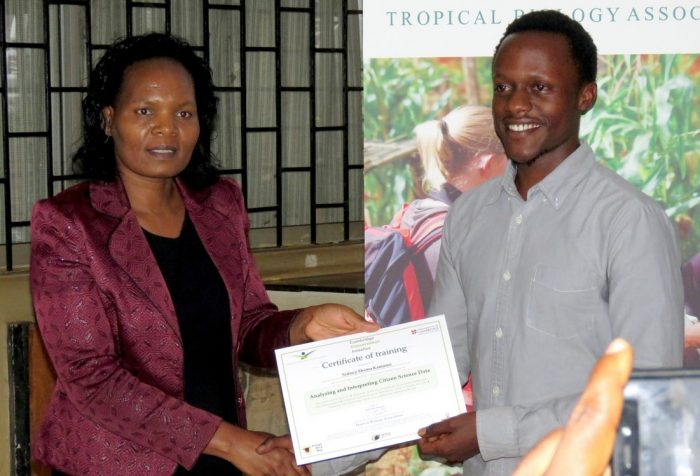
At the end of the course, each participant received a certificate. Here, Sidney Shema, who leads the bird atlas project in Kenya, is presented with his certificate by Professor Mary Gikungu, who is the Director of National Repositories and Research at our host institution, the National Museums of Kenya. Professor Gikungu is a entomologist specialising in bees.
Thank you to Rosie Trevelyan and Anthony Kuria (TBA) for the invitation to participate. It was a rich and rewarding experience. We hope that the BDI and the TBA can find ways to collaborate in the future.
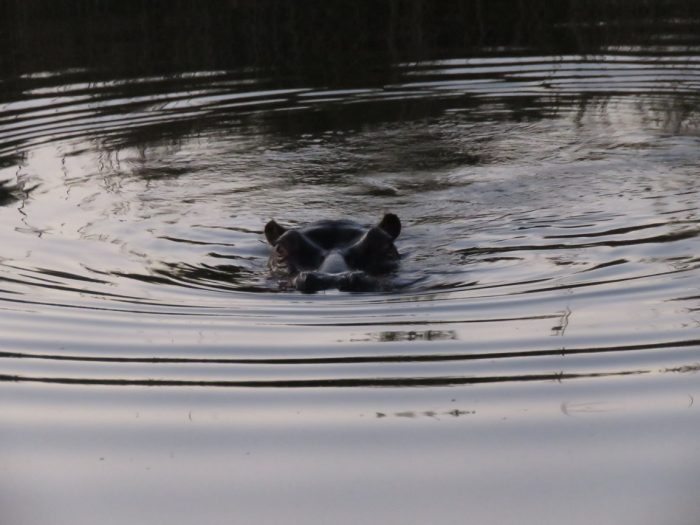
Within an hour of a dusk arrival at what was then known as the Karoo Gariep Nature Reserve (now the Khoisan Karoo Conservancy) …
… we had not only been shown the “hippo pool”, we had seen a hippopotamus …
The Seekoei River flows through PC Ferreira’s farm, New Holme, between Hanover and Colesberg in the Northern Cape, South Africa. PC investigated why the river was called the Seekoei (Hippo) River. He found that the last hippos along the Seekoei River had been on his farm, where they had been hunted to extinction in the late 1700s, probably 1778. PC worked for many years to get permission to do a re-introduction, and finally got it right to re-introduce a small group of hippos in 2006. For PC, this was the launch of a passion for conservation, and has transformed the traditional sheep farm of New Holme into a space where biodiversity takes precedence. It has official “nature reserve” status. PC is working with farmers all along the Seekoei River to establish a vast corridor of protected area.
The Karoo Gariep Nature Reserve at the farm New Holme is a locality where the Biodiversity and Development Institute will establish research projects for international and local students. The detailed planning for this is in progress, and we hope to have our first students busy on their projects early in 2020. This trip was part of the planning process. There are massive opportunities for fascinating projects here. Even though New Holme is almost exactly half way between Cape Town and Johannesburg, our accommodation is only 8 km from the N1, and there is a good bus service along this route between the two cities. The bus stops at Hanover, 25 km away.
Besides the business, we had fun …
PC and his family are magnificent hosts. One evening we were treated to a braai at the dam. Here, PC and one of his daughters, Iané, are baking bread over the coals. The dam is a waterbird paradise, and presents its own set of research opportunities.
Even though New Holme is a nature reserve, it is a working farm; PC has greatly reduced stocking rates of sheep below what is the norm for a Karoo farm. Behind the sheep are White-breasted Cormorants, Grey Heron and African Spoonbills. All these species were BirdPixed.
Rick Nuttall, from Bloemfontein, was also visiting New Holme for the weekend. Rick is a serious contributor to the Virtual Museum. And …
… here is the Black-winged Stilt he was stalking! Rick has uploaded this photograph to the BirdPix section of the Virtual Museum; it is curated for posterity at http://vmus.adu.org.za/?vm=BirdPix-79791. The number of species with photographic records in BirdPix for the quarter degree grid cell 3024DC is currently 82. Almost all of these records were made at the Karoo Gariep Nature Reserve. You can see the list by going to http://vmus.adu.org.za/vm_locus_map.php?vm=birdpix&locus=3024DC. On the right hand edge of the table containing the list of species, you can click on “records” and see the photographs which support the inclusion of the species on the list.
The karoo comes to life at night. An after-dinner drive into the veld with PC is an unforgettable experience. He has developed the concept of the “shy five” to rival the “big five”. And even though the Karoo is an arid region, the diversity of nocturnal animals can be astounding. Possible sightings include aardwolf, Cape fox, bat-eared fox, African wildcat, aardvark, porcupine, striped polecat, African striped weasel, and both small and large spotted genets. Really lucky visitors see the tiny and rare black-footed cat.
And here is Rod Green’s record of aardvark! (curated in MammalMAP at http://vmus.adu.org.za/?vm=MammalMAP-28072). Rod, photographer from Port Elizabeth, was also visiting for the weekend. He achieved this result under difficult circumstances!
In a nutshell, the Khoisan Karoo Conservancy is a remarkable place, and highly recommended. The BDI team looks forward to working closely with PC. Through this interaction we hope to provide research training and opportunities for both international and local students. We hope also to make a substantive contribution to biodiversity conservation in the Karoo.
Dark-backed Weavers are locally common in forest patches along the eastern seaboard of Africa and across Eastern and central Africa to Cameroon. Their nests may be obvious, hanging above forest paths. Nests of this species are invariably sited singly in trees, although occasionally an old nest or two from previous breeding seasons may be near the current nest. Nests usually have a long entrance tunnel. Nests of the Dark-backed Weaver may be viewed at a citizen science project, PHOWN (PHOtos of Weaver Nests).
Dark-backed Weaver at Nest
Less than 400 Dark-backed Weavers, however, have been ringed in South Africa, the lowest species total for any South African weaver species. This is partly due to the fact that they often forage high in the canopy, where it is difficult to place mist-nets, although they do descend to lower levels as well. They also usually occur in pairs, not in flocks as many of the gregarious weavers, although the Dark-backed Weaver may join foraging mixed-species flocks of insectivorous birds.
The oldest Dark-backed Weaver in the SAFRING database is 5 years 2 months (ring BH34002), but the longevity will be considerably more than this – most weavers have known longevities over 10 years.
Dark-backed Weavers show some plumage variation across their range in Africa – these variations are briefly listed under the different subspecies notes, together with a map of subspecies distributions, at the Weaver Watch species page. Biometrics also vary slightly across its range, but not in any obvious pattern.
Dark-backed Weaver adult
Dark-backed Weaver males and females are alike. Juveniles are similar to adults, but there are some features that help separate juveniles (photo below) from adults (photo above). Juveniles have:
• pale gape flanges
• a paler bill (with a yellow tinge in above above, compared to bluish-grey in adult)
• mottled or pale throat
• darker brown eye
On Sunday morning, 5 May 2019, the grid cell “Yzerfontein” had 15 BirdPix* records for 12 species. This called for an intervention! So I went BirdPixing in Yzerfontein. This took the form of a morning’s expedition. (* BirdPix is a citizen science project building a photographic bird atlas of Africa, and the data will supplement that of the Second Southern African Bird Atlas Project (SABAP2).)
Here are the thumbnails of these 15 records arranged as a collage! Most of them are from Dassen Island, which falls within this grid cell. So there was lots of scope to add species from the mainland!
To a 72-year old arriving in Yzerfontein in 2019, the most striking thing about the place is how much it has grown. The map on the left is the 1:50,000 map which we used when the Western Cape Wader Study Group did the surveys of wader populations along the coastline in the 1970s. The pencil lines mark the count sections used in the surveys. The village, then officially called Ysterfontein, is tiny. The longest length of the village is shorter than the length of the name on the map. The 2019 Google satellite image shows the massive expansion of the built-up area. It’s now a small town, with supermarkets. A shopping mall is on the way!
It’s not hard to understand the attraction. The view south towards Table Mountain is pretty stunning.
For some bird species, the development provides new opportunities. For example, …
… palm trees in the gardens provide breeding opportunities for Cape Weavers. With the natural coastal vegetation, there would be no weavers here. This colony is curated in PHOWN (PHOtos of Weaver Nests) at http://vmus.adu.org.za/?vm=PHOWN-28432.
At some stage in the future, this Grey-backed Cisticola (http://vmus.adu.org.za/?vm=BirdPix-77410) will lose its home to the development staked out by this steel peg.
But the town layout contains a fair amount of open space. This will preserve corridors of natural habitat, and many species of birds will persist in them.
In a coastal town in the Western Cape, such as Yzerfontein, there is often a gathering place for Hartlaub’s Gulls (http://vmus.adu.org.za/?vm=BirdPix-77382). In Yzerfontein, the roof of NSRI Station 34 was the scene of action. It is worth searching through a flock like this for Grey-headed Gulls. A vaguely grey hood – there are at least two in the photo above – is not enough. Grey-headed Gulls have distinctly whitish eyes and the eyes of Hartlaub’s Gulls are dark brown, almost black. The careful scrutiny of the gulls revealed …
… a pink-headed Gull! This bird has a whitish eye (so a Grey-headed Gull), but has a pinkish wash in the places where it ought to have grey! So this photo (and two more) have been uploaded to the BOP section of the Virtual Museum (BOP = Birds with Odd Plumage) where they are curated in perpetuity (see http://vmus.adu.org.za/?vm=BOP-552). There has been a bit of an outbreak of pink in BOP, especially among the Cattle Egrets (for example, and most spectacularly, at http://vmus.adu.org.za/?vm=BOP-523, and look at this Hartlaub’s Gull http://vmus.adu.org.za/?vm=BOP-524).
Yzerfontein, superficially, is a peaceful coastal town. But dressed in black, and openly displaying their red dagger-shaped weapons, here are the Yzerfontein hooligans. This is just part of the flock of frustrated bachelors and spinsters; there were about 30 in total. These are adolescent and young adult African Oystercatchers (http://vmus.adu.org.za/?vm=BirdPix-77391). Their sole objective in life is to disrupt the lives of established breeding pairs along the coastline. The establishment of these flocks is evidence of an “over-production” of oystercatchers in recent decades. This, in turn, is a consequence of the invasion of their range of the Mediterranean mussel Mytilus galloprovincialis which grows faster and higher up the intertidal than the indigenous mussel which it has replaced. It is not much fun being an adult oystercatcher on the coastline these days. Either you are frustrated because you don’t have a mate or a territory. Or you spend your life keeping an eye on your mate, and warding off attacks by the hooligans.
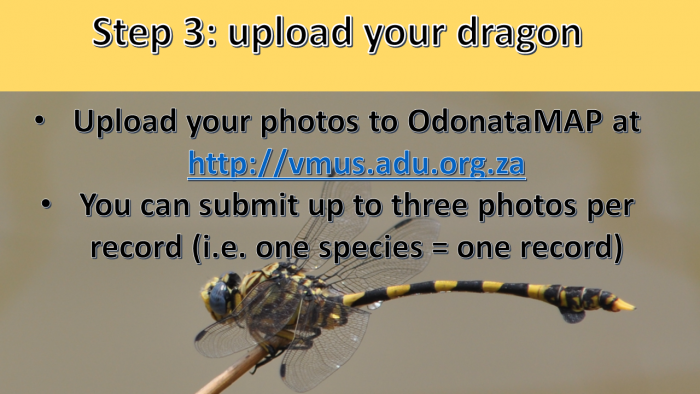
I was alert to opportunities to contribute to other sections of the Virtual Museum. A lizard basking in the sun, or a snake squashed on the road, is a ReptileMAP opportunity. The dragonflies in the stream that passes under the road can be OdonataMAPped. A family of dassies sunning themselves on the rocks can go into MammalMAP. Butterflies are usually a big challenge; but this Common Dotted Border was very co-operative. The photo is not all it could be, but it is good enough for a positive identification (curated at http://vmus.adu.org.za/?vm=LepiMAP-682293).
At the end of a morning full of fun and interest, the number of BirdPix records increased from 15 to 67, and the number of species from 12 to 39. I created quite a few duplicates by including records of the same species both for the agricultural sector of the grid cell, and for the built-up area. The collage of thumbnails for the quarter degree grid cell 3318AC Yzerfontein has improved from the one at the top of this blog to the one below, at the end! BirdPixing in Yzerfontein proved pretty rewarding.
You can get the map of the grid cell and the full list list of the BirdPix species (possibly updated) by going to http://vmus.adu.org.za/vm_locus_map.php?vm=birdpix&locus=3318AC. You can create the collage below by clicking on “Records for 3318AC” and then clicking on “Display thumbnails only”.
Mansell M, Underhill LG, and Navarro R. 2019. LacewingMAP – Progress report on the Atlas of African Neuroptera and Megaloptera, 2014 – 2019. Biodiversity Observations 10.10:1-21
LacewingMAP – Progress report on the Atlas of African Neuroptera and Megaloptera, 2014 – 2019
Mervyn Mansell
Department of Zoology and Entomology, University of Pretoria, Pretoria, 0002 South Africa
Les G Underhill
Animal Demography Unit, Department of Biological Sciences, University of Cape Town, Rondebosch, 7701 South Africa; Biodiversity and Development Institute, 25 Old Farm Road, Rondebosch, 7700 South Africa
Rene Navarro
Animal Demography Unit, Department of Biological Sciences, University of Cape Town, Rondebosch, 7701 South Africa; FitzPatrick Institute of African Ornithology, Department of Biological Sciences, University of Cape Town, Rondebosch, 7701 South Africa
Abstract
This report describes progress with the atlas of lacewings, defined as the orders Neuroptera and Megaloptera, up to 31 March 2019. The database of the project contained 15,781 records, in two components – 12,898 specimen records and 2,883 photographic records – submitted to the LacewingMAP section of the Virtual Museum, over a period of 4.5 years (September 2014 to March 2019). The average rate of submission of photographic records for LacewingMAP for the four calendar years 2015 to 2018 was 566 per year, three times faster than the rate at which the specimen database grew during the second half of the 20th century. 234 citizen scientists contributed photographic records to LacewingMAP. It seems that almost all of these people have primary interests in other taxa, and that the records submitted to LacewingMAP were a ‘by-catch’. Photographs of at least two new species were submitted by citizen scientists during 2018.
What are the lacewings, and why are they interesting?
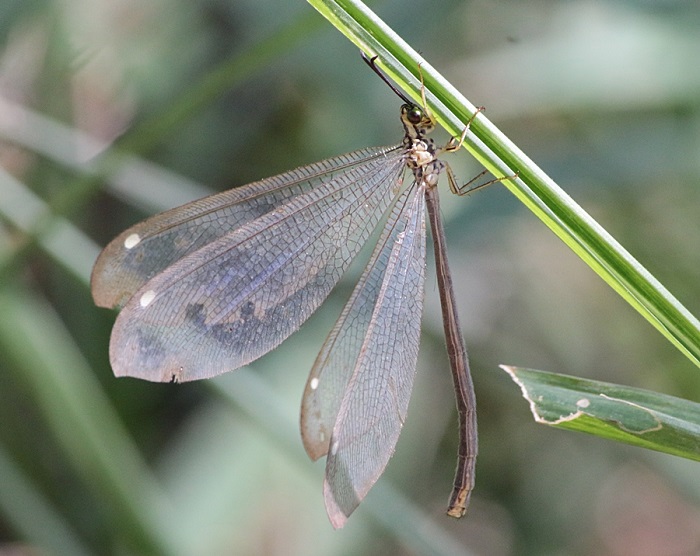
We live in a world which is lacewing-blind. Most people would not be able to identify a flying insect as a lacewing, let alone distinguish between species (Figures 1 and 2). But almost everyone has encountered an artefact created by the larvae of lacewings. They recognize the distinctive funnel-shaped pits in sandy areas (Figure 3), and they have been told that there is a beast called an antlion lying in wait below to consume any insect that slips down the side of the funnel. But, few people grasp that the antlion is to the lacewing what the caterpillar is to the butterfly. They are blind to the existence, and value, of lacewings, the adults of the creatures that live in the sand.
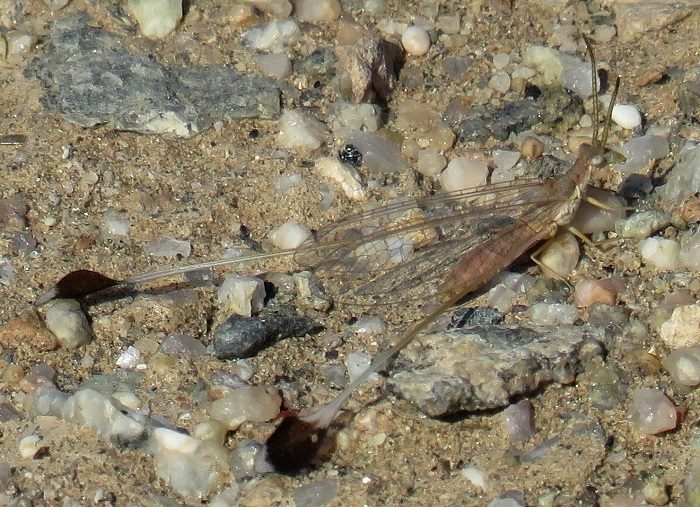
Fig 1. With 518 records, Myrmeleon obscurus is the most frequently recorded species in the LacewingMAP database. There are 124 photographic records. This photograph was taken by Alan Manson in Pietermaritzburg, KwaZulu-Natal. This record is curated at http://vmus.adu.org.za/?vm=LacewingMAP-9551
Fig 2. With 516 records, Hagenomyia tristis is the second most frequently recorded species in the LacewingMAP database. There are 154 photographic records. This photograph was taken by Bernardine Altenroxel near Mooketsi, Limpopo. This record is curated at http://vmus.adu.org.za/?vm=LacewingMAP-596
Fig 3. The conical pit-trap constructed in sand or loose soil by larvae of some antlions. The larvae buries itself at the bottom. Ants and other small arthropods fall over the edge, slip to the bottom of the pit-trap and are unable to climb out because of the steepness of the slope and the looseness of the sand. They are pounced on by the ant-lion larva, which then sucks the body fluids out of its prey. The dry husk is tossed out of the pit, which is then repaired.
13 of the 16 recognised families of Neuroptera occur in southern Africa, and both families of Megaloptera. This report focuses mainly on the Neuroptera, popularly known as lacewings. The Afrotropics (i.e. Africa south of the Sahara Desert) has an especially rich and varied fauna of lacewings and approximately 500 species occur in southern Africa alone, defined as the region south of the Kunene and Zambezi Rivers (Mansell 2002). Furthermore, about half of these are endemic to this area.
Neuroptera are excellent indicators of environmental and habitat transformation, and include key species for signifying areas and faunas that require priority protection. They are vulnerable to habitat fragmentation and pesticide contamination (Mansell 2002, Winterton et al. 2010).
The larvae of the lacewings are all specialised predators with unique, highly evolved mouthparts. As predators, lacewing larvae have the potential to have a major impact upon populations of other insects and small Arthropoda, and especially aphids. They have therefore, long been considered an attractive option as biological control agents in greenhouses, orchards and fields (New 1975, Mansell 2002). The recommendation is to augment species native to an area by means of mass rearing, and not to introduce new lacewing species (New 1985).
Only one of the families, the Myrmeleontidae, includes species whose larval stage consists of antlions that construct funnel-shaped pits in sand (Figure 3). The larvae of the other families take on a diverse variety of forms; they range from aquatic to semi-aquatic, and there are species with larvae which live freely in sand, under rock ledges, small caves, holes in trees, and as free-living ambush predators on vegetation. Some are parasites in spider nests, and inquilines in ant nests. Nothing is known about the larvae of some species (Mansell 2002, Winterton et al. 2010).
The Neuroptera are model subjects for scientific research because they have a wide diversity of lifestyles. Adults of several families are key pollinators of indigenous flora; especially the family Nemopteridae (the thread-wing and the spoon-and ribbon-wing lacewings) (Mansell 2002).
What is the objective of LacewingMAP?
Given that the lacewings are important, the long-term objective of the LacewingMAP project is to develop an atlas of the distributions of the Neuroptera and Megaloptera in Africa, focusing initially on southern Africa, then the Afrotropics, and ultimately the African continent. The project is loosely modelled on the “butterfly atlas” and the “reptile atlas” (Mecenero et al. 2013, Bates et al.2014). For both those projects, the foundational data were the historical specimen record data, supplemented by photographic data uploaded to the “Virtual Museum” by citizen scientists. The Virtual Museum is described by Mecenero et al. (2013) and Bates et al. (2014). The lacewing atlas uses the same strategy. Specimen records were (and continue to be) assembled by us, photographic records are collected by citizen scientists, and the combined database is curated by the Virtual Museum.
This report reviews progress up to March 2019. The first image of a lacewing was uploaded to the LacewingMAP section of the Virtual Museum on 19 September 2014. This report is based on the specimen database, plus photographic records assembled over four and a half years, up to 31 March 2018.
What is the volume of records in the LacewingMAP database?
The total number of records in the LacewingMAP database on 31 March 2019 was 15,781 (Table 1). They are split into two components in this database, seamlessly merged as a single entity. The largest component consists of 12,898 records, mainly based on museum specimens, assembled by us, and recorded in a Palpares Relational Database (Mansell & Kenyon 2002). This is supplemented by 2,883 photographic records, submitted to the LacewingMAP section of the Virtual Museum (http://vmus.adu.org.za) by citizen scientists (Table 1). Each photographic record uploaded to the Virtual Museum contains either one, two or three images of the live animal; each record is evaluated by us, and we allocate it to family, genus or species.
Table 1. Numbers of LacewingMAP records for African countries on 31 March 2019. The second column gives the number of photographic records uploaded by citizen scientists; the third total gives the total number of records in the database for each country.
Country
LacewingMAP
Total
Algeria
1
Angola
5
38
Benin
11
Botswana
100
391
Burkina-Faso
26
Burundi
2
Cameroon
33
Cape Verde Islands
11
Central African Republic
8
Chad
8
Comoros
13
Democratic Republic of Congo
3
708
Djibouti
8
Equatorial Guinea
20
Eritrea
6
Ethiopia
15
Gabon
25
Gambia
17
Ghana
1
20
Guinea
19
Ivory Coast
36
Kenya
23
205
Lesotho
1
10
Liberia
1
3
Madagascar
4
115
Malawi
170
342
Mali
49
Mauritania
10
Mauritius
3
Mozambique
43
144
Namibia
90
1,020
Niger
24
Nigeria
11
54
Reunion
4
Rwanda
3
Senegal
51
Seychelles
14
Sierra Leone
1
5
Socotra Island (Yemen)
4
Somalia
1
24
South Africa
2,225
10,917
St Helena
2
Sudan
8
20
Swaziland
87
197
Tanzania
13
119
Togo
11
Uganda
21
Zaire
4
Zambia
87
346
Zimbabwe
9
644
Total
2,883
15,781
The majority of the 2,883 photographic records, uploaded to the Virtual Museum were submitted from South Africa (2,225, 77%) (Table 1). A total of 658 records were submitted from 20 other African countries; six countries had more than 40 records: Malawi (170), Botswana (100), Namibia (90), Swaziland (87), Zambia (87) and Mozambique (43) (Table 1).
In the overall database, 10,917 records are from South Africa (Table 1). Countries with totals more than 500 records are Namibia (1,020), Democratic Republic of Congo (708) and Zimbabwe (644) (Table 1). 50% of Malawi’s 342 records are photographic, as are 44% of Swaziland’s 197 records, and 30% of Mozambique’s 144 (Table 1).
Within the nine provinces of South Africa, the largest contributions of photographic records have come from Northern Cape (484, 21.7% of total of 2,222 for South Africa), Limpopo (456, 20.5%) and KwaZulu-Natal (420, 18.5%) (Table 2). Within the database as a whole, Limpopo has the most records (2,606, 24.6% of 10,594 records for South Africa) and the Northern Cape has 1,688 (15.9%) (Table 2). Three of the photographic records and 323 of the total records from South Africa did not have “province” assigned (Tables 1 and 2).
Table 2. Numbers of LacewingMAP records for the provinces of South Africa on 31 March 2019. The second column gives the number of photographic records uploaded by citizen scientists; the third total gives the total number of records in the database for each province.
Province
LacewingMAP
Total
Eastern Cape
180
867
Free State
65
225
Gauteng
171
918
KwaZulu-Natal
420
1,390
Limpopo
456
2,606
Mpumalanga
161
1,110
North-West
38
622
Northern Cape
484
1,688
Western Cape
249
1,168
Total
2,222
10,594
The average rate of submission of photographic records for LacewingMAP for the four years 2015 to 2018 was 566 per year (Table 3). This rate can be compared with the annual collection rate for the specimen section of the database (Table 4). The photographic rate generated by citizen scientists is 64% above the “best” decade (the 1980s), 5.5 times more than the 20th century as a whole (102 per year), and three times more than the second half of the 20th century (176 per year) (Table 4).
Table 3. Annual totals (1 January to 31 December of each calendar year) of photographic submissions to the LacewingMAP section of the Virtual Museum. The row Pre-start refers to records of lacewings submitted to OdonataMAP. These were not deleted from the Virtual Museum database, and were re-allocated to LacewingMAP when the project started (see Figure 2). The total for 2019 is incomplete.
Year (Jan to Dec)
Number of submissions
Pre-start
21
Sep to Dec 2014
299
2015
547
2016
502
2017
536
2018
678
Jan to Mar 2019
300
Total (31 Mar 2019)
2883
Table 4. Using the specimen database, the average number of records per year was calculated for each decade of the 20th century, and the 21st century to date.
Decade
Records per year
1900-09
10.8
1910-19
29.1
1920-29
36.0
1930-39
48.6
1940-49
20.4
1950-59
63.3
1960-69
75.0
1970-79
151.3
1980-89
345.5
1990-99
244.1
2000-09
136.9
2010-18
61.3
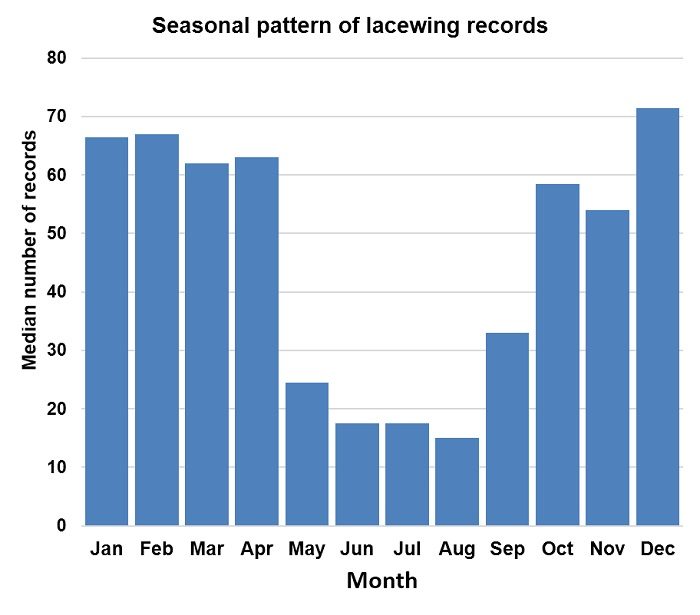
The monthly pattern of submissions shows a minimum in the winter months from May to August, and a peak in the summer months from December to April (Figure 4). This plot confirms the general pattern of seasonality of conspicuous occurrence of lacewings.
Fig 4. The histogram shows the seasonal pattern of the submission of photographic records to the LacewingMAP section of the Virtual Museum. The height of the bar for each month is the medians of the number of records submitted in that month over the four years 2015 to 2018.
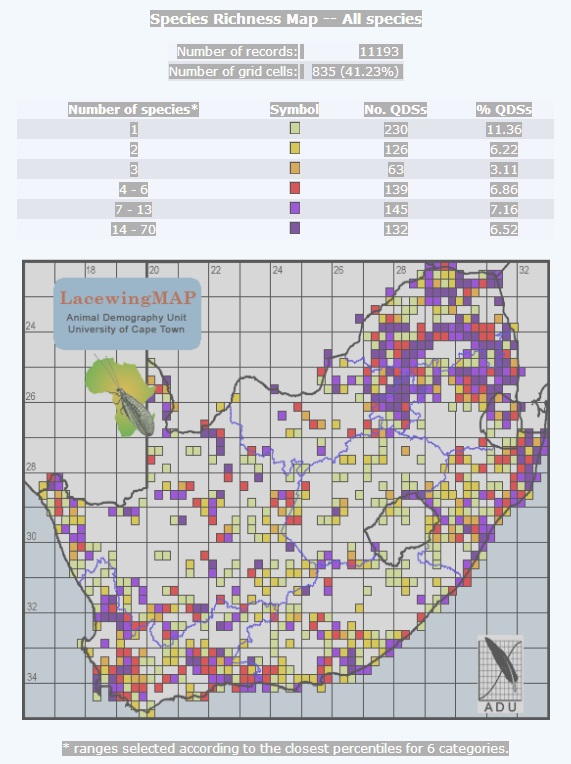
Each record is georeferenced as accurately as feasible. For mapping purposes each record is allocated to a quarter degree grid cell. This 15-minute grid system has been widely used by biodiversity atlas projects in southern Africa (e.g. Mecenero et al. 2013, Bates et al. 2014). The 15-minute (quarter degree) grid generates 2025 quarter degree grid cells in South Africa, Lesotho and Swaziland. Of these, 835 grid cells (41.2%) have at least one species of lacewing recorded (Figure 5). 230 grid cells have a single species recorded in them. On the other hand, there are only two degree cells with no records at all, one in the Northern Cape and one in North West Province. At this stage, the patterns of species richness still reflect observer effort rather than the true distribution of species richness.
Fig 5. LacewingMAP species richness in South Africa, Lesotho and Swaziland per quarter degree grid cell, on 31 March 2019. The species richness is grouped into six classes, with the cutpoints chosen so that, as close as possible with integer arithmetic, 1/6th of the grid cells have the same colour. There is at least one species recorded in 835 of the 2,025 grid cells in the three countries (41.2%).
What species are in the LacewingMAP database?
The taxonomy upon which LacewingMAP is based contained 1,249 species in March 2019 (Table 5); this taxonomic spine, which is pivotal for the project, is updated from time to time, as necessary. This taxonomy is of Afrotropical species; 18 of these species are from the order Megaloptera (two families Corydalidae and Sialidae), and the remaining 1,231 species are Neuroptera, classified into 13 families (Table 5). By far, the largest family is the Myrmeleontidae, containing 461 species. 415 species of Neuroptera are currently known from South Africa (Mansell & Oswald 2018), and 834 from the remainder of the Afrotropical Region, i.e. species that do not occur in South Africa.
Table 5. The column headed ‘Sp. in tax.’ (Species in taxonomy) provides the number of species in each of the 15 families in the two orders (Megaloptera and Neuroptera). This is based on the taxonomy in use in LacewingMAP in March 2019. This taxonomic ‘spine’ is updated at intervals. The remaining columns provide the number of photographic records for each Family which were identified to Family (only), Genus (only) and Species level. For each family, the total number of photographic records is provided (Total), and also the number of species they represent (Sp. rec.).
Order
Family
Sp. in tax.
Family
Genus
Species
Total
Sp. rec.
Megaloptera
Corydalidae
14
0.0
0.0
0
0
0
Megaloptera
Sialidae
4
0.0
0.0
0
0
0
Neuroptera
Osmylidae
18
3.0
0.0
1
4
1
Neuroptera
Nemopteridae
87
0.0
32.0
56
88
11
Neuroptera
Mantispidae
100
49.0
7.0
6
62
2
Neuroptera
Dilaridae
1
0.0
0.0
0
0
0
Neuroptera
Psychopsidae
10
0.0
2.0
42
44
4
Neuroptera
Myrmeleontidae
462
51.0
393.0
1,441
1,885
88
Neuroptera
Hemerobiidae
55
8.0
18.0
19
45
8
Neuroptera
Coniopterygidae
100
1.0
0.0
0
1
0
Neuroptera
Chrysopidae
200
217.0
127.0
184
528
25
Neuroptera
Rhachiberothidae
11
0.0
0.0
0
0
0
Neuroptera
Berothidae
30
0.0
8.0
0
8
0
Neuroptera
Ascalaphidae
146
26.0
26.0
136
188
25
Neuroptera
Sisyridae
11
0.0
0.0
0
0
0
Totals
1,249
355.0
613.0
1,885
2,853
164
Percentages
12.4
21.5
66.1
100.0
NA
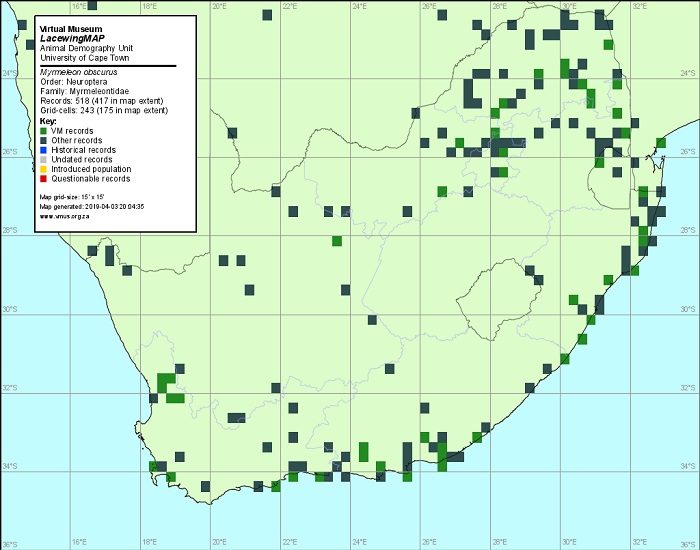
Of the 1,249 species in the taxonomy, the overall LacewingMAP database (specimens and photographs) contained records for 952 on 31 March 2019. 20 species had 148 or more records, of which 18 were members of the family Myrmeleontidae (Table 6). The two species with the most records were Myrmeleon obscurus (518) and Hagenomyia tristis (516) (Figures 1 and 2). The distribution maps for these two species within South Africa, Lesotho and Swaziland (Figures 6 and 7) show distinctly different patterns: it seems probable that Myrmeleon obscurus occurs throughout South Africa (Figure 6), but that Hagenomyia tristis is confined to the eastern half of the country (Figure 7).
Table 6. The 20 species with the largest numbers of records in the LacewingMAP database (specimen and photographic records combined) on 31 March 2019. The first column provides the species codes used in the Virtual Museum database.
Species code
Family
Species
Records
328640
Myrmeleontidae
Myrmeleon obscurus
518
328240
Myrmeleontidae
Hagenomyia tristis
516
327920
Myrmeleontidae
Cueta trivirgata
456
329340
Myrmeleontidae
Palpares caffer
395
327380
Myrmeleontidae
Banyutus lethalis
360
327780
Myrmeleontidae
Creoleon mortifer
350
328560
Myrmeleontidae
Myrmeleon alcestris
272
327540
Myrmeleontidae
Centroclisis brachygaster
252
328960
Myrmeleontidae
Nesoleon boschimanus
249
328220
Myrmeleontidae
Hagenomyia lethifer
243
329060
Myrmeleontidae
Neuroleon chloranthe
235
328360
Myrmeleontidae
Macroleon quinquemaculatus
230
328580
Myrmeleontidae
Myrmeleon doralice
228
327900
Myrmeleontidae
Cueta punctatissima
226
331520
Psychopsidae
Silveira marshalli
182
329520
Myrmeleontidae
Palpares sobrinus
174
321140
Ascalaphidae
Proctarrelabis involvens
163
329560
Myrmeleontidae
Palpares speciosus
163
328320
Myrmeleontidae
Lachlathetes moestus
155
327740
Myrmeleontidae
Creoleon diana
148
Fig 6. Distribution map for Myrmeleon obscurus (Figure 1) in South Africa, Lesotho and Swaziland.
Fig 7. Distribution map for Hagenomyia tristis (Figure 2) in South Africa, Lesotho and Swaziland.
All 12,898 records in the specimen database are identified to species. Species level identification from photographs is not always possible because many lacewings, and especially the species of “green lacewings” of the family Chrysopidae, can only be identified by dissection.
By 31 March 2019, we had undertaken identifications of 2,853 of the 2,883 photographic records submitted by citizen scientists. This provides a large sample of records from which we can attempt to quantify the extent of the identification issues. 1,885 of the 2,853 records (66.1%) were identified to species level, 613 (21.5%) to genus level only, and 355 (12.4%) to family level only (Table 5). Of those identified to family level only, 217 records (61%) were Chrysopidae (green lacewings), 50 records (14%) were Myrmeleontidae (antlions) and 49 records (14%) were Mantispidae (mantidflies) (Table 5).
Of the 613 records identified to genus level only (Table 5), 348 belonged to five genera: 105 in the genus Chrysoperla in the family Chrysopidae, and 83, 79, 67, and 55 in the genera Centroclisis, Cueta, Myrmeleon and Creoleon, respectively, of the family Myrmeleontidae (antlions). In summary, the green lacewings, i.e. the family Chrysopidae and especially the genus Chrysoperla within this family, and four genera within the family Myrmeleontidae (antlions) present the largest identification challenges from photographs.
In the photographic database, of the 22 species with more than 20 records (Table 7), 15 are also in Table 6, the top 20 species overall. There is one species in Table 7 for which more than half of all records are photographic: Dichochrysa tacta (recently renamed Pseudomallada tactus) has 43 photographic records and 41 specimen records. The distribution map (Figure 8) demonstrates how the photographic records are helping to “fill in” the range suggested by the specimen records.
Table 7. The 22 species with with more than 20 photographic records in the LacewingMAP database on 31 March 2019. The first column provides the species codes used in the Virtual Museum database.
Species code
Family
Species
Records
328240
Myrmeleontidae
Hagenomyia tristis
154
327380
Myrmeleontidae
Banyutus lethalis
146
328640
Myrmeleontidae
Myrmeleon obscurus
124
329340
Myrmeleontidae
Palpares caffer
116
327780
Myrmeleontidae
Creoleon mortifer
66
327920
Myrmeleontidae
Cueta trivirgata
51
328360
Myrmeleontidae
Macroleon quinquemaculatus
60
328220
Myrmeleontidae
Hagenomyia lethifer
47
328320
Myrmeleontidae
Lachlathetes moestus
43
323500
Chrysopidae
Dichochrysa tacta
43
327900
Myrmeleontidae
Cueta punctatissima
43
329520
Myrmeleontidae
Palpares sobrinus
42
329560
Myrmeleontidae
Palpares speciosus
38
322860
Chrysopidae
Chrysemosa jeanneli
34
329060
Myrmeleontidae
Neuroleon chloranthe
30
328560
Myrmeleontidae
Myrmeleon alcestris
29
320900
Ascalaphidae
Eremoides bicristatus
29
328580
Myrmeleontidae
Myrmeleon doralice
26
329440
Myrmeleontidae
Palpares inclemens
25
327880
Myrmeleontidae
Cueta mysteriosa
23
328960
Myrmeleontidae
Nesoleon boschimanus
23
320560
Ascalaphidae
Ascalaphus bilineatus
21
Fig 8. Distribution map for Dichochrysa tacta, recently renamed Pseudomallada tactus, in South Africa, Lesotho and Swaziland. Orange squares denote grid cells having specimen records, and turquoise circles denote grid cells having photographic records.
The genus Dichochrysa (now Pseudomallada) is part of the family Chrysopidae, the green lacewings, for which identifications are generally difficult. However, along with the genus Italochrysa, most photographic records for both genera were identified to species (88% and 86%, respectively) (LacewingMAP database).
Who are the main contributors of photographic records to the LacewingMAP database?
By March 2019, 234 people had submitted records to LacewingMAP; 36 had submitted more than 20 records (Table 8). It is true to state that none of these 36 people have a primary interest in the lacewings (in the way that people have primary interests in a particular taxon, such as birds, butterflies, reptiles, dragonflies and damselflies, or even spiders or scorpions). 90 people had submitted a single record, and the median number of submissions per observer was three. The Virtual Museum had a total of 2,256 observers on 31 March 2019. Only eight of the 234 participants in LacewingMAP had submitted records only to this section of the Virtual Museum (seven had submitted one record, and one person had submitted 12, the only specialist LacewingMAPper). For 98.8% of the 2,256 Virtual Museum participants, submissions to LacewingMAP were less than 10% of their total numbers of records submitted. These observations suggest that photographic records are submitted to LacewingMAP opportunistically, as they are encountered. The lacewings are an extremely valuable by-catch.
Table 8. 36 citizen scientists had submitted 20 or more photographic records to LacewingMAP in the period September 2014 to March 2019.
Citizen scientist
Records
Altha Liebenberg
235
Ryan Tippett
193
Gary Brown
161
Vaughan Jessnitz
130
Zenobia van Dyk
107
Alan Manson
102
Dewald du Plessis
90
Kate Braun
81
Pieter Cronje
76
Craig Peter
76
Bernardine Altenroxel
70
Christopher Willis
68
Len de Beer
67
James Harrison
53
Norman Barrett
51
John Wilkinson
46
Luke Kemp
45
Johan Heyns
44
Neil Thomson
39
Sonja Maartens
36
Corné Rautenbach
34
Marita Beneka
33
Les Underhill
32
Rob Dickinson
30
Ross Hawkins
30
Joseph Heymans
30
Fanie Rautenbach
30
Joubert Heymans
28
Quartus Grobler
27
Gert Myburgh
27
Michael Holden
26
Johnstone, Richard Alan
26
Hodgson, Andrew & Heather
24
Dawie de Swardt
23
Joan Young
22
Dave Kennedy
21
What are some of the interesting photographic records in LacewingMAP?
LacewingMAP has contributed many interesting and valuable locality records. It has added a vast number of new locality records and has contributed to our overall knowledge of the distribution of Afrotropical lacewings. Thus it is difficult to single out individual records.
Two records, both from 2018, are outstanding. They highlight the value of the contribution being made by citizen scientists.
LacewingMAP record 15379 is a specimen from Lüderitz Peninsula, southwestern Namibia, on 24 July 2018 (Figure 9). It belongs to the the genus Palmipenna. It is doubtless an undescribed species, remarkable for its early appearance (July) and its close proximity to the sea. This record was a total surprise. It is the farthest north that this genus has ever been recorded, and the second record of this genus from Namibia. Previous records of this genus were almost exclusively from the Western Cape, South Africa.
Fig 9. LacewingMAP record 15379, which is probably a new species in the genus Palmipenna, from the Lüderitz Peninsula, Namibia. It was submitted by Jessica Kemper, and further details are at http://vmus.adu.org.za/?vm=LacewingMAP-15379
LacewingMAP record 10583 is a specimen of a new antlion (Myrmeleontidae), either in the genus Fadrina or the genus Centroclisis (Figure 10). It cannot be placed with certainty; it has characteristics of both, and also remarkable for its small size. Provisionally, it is placed in Fadrina because of the double costal series in the forewings. This lacewing was found in the Cederberg area on 22 January 2018. This photographic record alerts us to the existence of a previously unknown taxon. It also emphasizes the exceptional lacewing diversity of the Cederberg.
Fig 10. LacewingMAP record 10583, which is probably a new species in the genus Fadrina, from the Cederberg area, Western Cape. It was submitted by Zenobia van Dyk and further details are at http://vmus.adu.org.za/?vm=LacewingMAP-10583
What are the priorities for fieldwork for LacewingMAP?
The answer to this is simple. At this stage in the life-cycle of the LacewingMAP project every record, from anywhere in Africa, is valuable.
How do I participate in LacewingMAP?
In a nutshell, the protocol is simple. Take photographs of lacewings, and upload them to the LacewingMAP section of the Virtual Museum website. There is no need to identify the species in the photograph. This gets done by the expert panel for LacewingMAP.
The easiest way to take photographs of lacewings is to be aware that they are attracted to light at night, in exactly the same way that moths are, although usually in far smaller numbers. The entire spectrum of cameras are used to take photographs of lacewings; the most versatile for this type of photography are the new generation of “compact” cameras
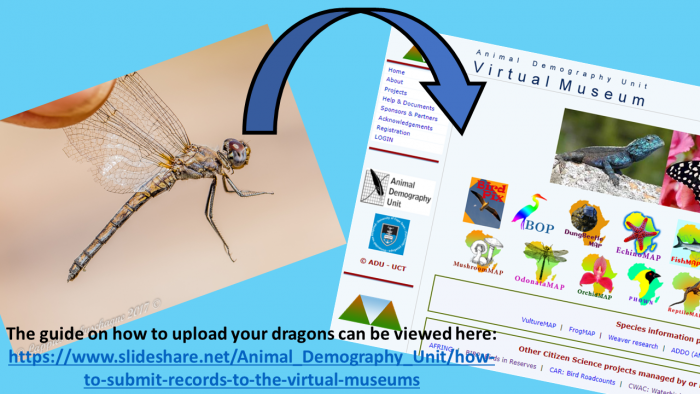
Once you are registered, you log on to the website using your email address and password. A “Data upload” section now becomes visible. The critical information that needs to be uploaded into the database is date, place and a series of one to three photographs of a single species, usually different angles on the same individual. Guidance on the upload process is provided in this slide show: https://www.slideshare.net/Animal_Demography_Unit/how-to-submit-records-to-the-virtual-museums
We do our best to identify each record to species level. As described earlier, this is difficult to achieve for several of the lacewing families, and especially for the green lacewings. But this should not deter you from submitting photographs. As a beginner participant, the best strategy for a positive confirmed identification is to take lots of photos of a specimen, and to select the best one, two or three photographs for submission, preferably from different angles. It is helpful to try to get different parts of the specimen in sharp focus in the three pictures.
Acknowledgements
We thank all the contributors to the LacewingMAP project for their photographs, and all those who collected specimens over the years, upon which the original dataset is based. We gratefully acknowledge the South African Biodiversity Information Facility (SABIF), the Global Biodiversity Information Facility (GBIF) and especially the JRS Biodiversity Foundation, Seattle, USA, for supporting the databasing of Afrotropical lacewings, which underpins this project. Museum specimen records were (and continue to be) assembled by MM. The expert panel for LacewingMAP is lead by MM, who evaluates all photographic submissions and attempts to assign records to species level.
References
Bates MF, Branch WR, Bauer AM, Burger M, Marais J, Alexander GJ, de Villiers MS (eds) 2014. Atlas and Red List of the reptiles of South Africa, Lesotho and Swaziland. Suricata 1. Pretoria: South African National Biodiversity Institute.
Erasmus BFN, Kshatriya M, Mansell MW, Chown SL, Van Jaarsveld AS 2000. A modelling approach to antlion (Neuroptera: Myrmeleontidae) distribution patterns. African Entomology 8: 157-168.
Freitag S, Mansell M 1997. The distribution and protection status of selected antlion species (Neuroptera: Myrmeleontidae) in South Africa. African Entomology 5: 205-216.
Mansell MW 2002. Monitoring lacewings (Insecta: Neuroptera) in southern Africa. Acta Zoologica Academiae Scientiarum Hungaricae 48 (Suppl. 2): 165-173.
Mansell MW, Kenyon B 2002. The Palpares relational database: an integrated model for lacewing research. Acta Zoologica Academiae Scientiarum Hungaricae 48 (Suppl. 2): 185-195.
Mecenero S, Ball JD, Edge DA, Hamer ML, Henning GA, Krüger M, Pringle EL, Terblanche RF, Williams MC (eds) 2013. Conservation assessment of butterflies of South Africa, Lesotho and Swaziland: Red List and atlas. Johannesburg: Saftronics and Cape Town: Animal Demography Unit.
New TR 1975. The biology of Chrysopidae and Hemerobiidae (Neuroptera), with reference to their usage as biocontrol agents: a review. Ecological Entomology 127: 115-140.
Winterton SL, Hardy NB, Wiegmann BM 2010. On wings of lace: phylogeny and Bayesian divergence time estimates of Neuropterida (Insecta) based on morphological and molecular data. Systematic Entomology 35: 349-378.
Paardeberg Inselberg is surrounded by vineyards and farms, but patches of fynbos, trees, farm dams, homestead gardens provide varied habitat and good diversity of birds. Ringing has been conducted at Bowwood farm and Fynbos Estate.
On 27 April 2019 Loutjie Steenberg, Taylyn Risi and I ringed on Sonop farm and caught 43 birds of 13 species. Three birds were recaptures from a previous ringing visit by Loutjie on 29 July 2018 – a Karoo Prinia, a Cape Weaver and a Southern Masked Weaver.
The Southern Masked Weaver shown was a recapture – it was moulting its head feathers into breeding plumage (the growing feathers with sheaths were black or yellow), rather early for a weaver in a rural area.
The species of the day was Neddicky, being the first time this species has been ringed anywhere on the Paardeberg.
Neddicky
This ringing session brings a total of 777 birds of 39 species ringed on the Paardeberg over 2018-19.
Bird conservation in Africa – the contributions of the Ibadan Bird Club
Adewale G Awoyemi
Forest Unit, International Institute of Tropical Agriculture, Ibadan, Nigeria; A. P. Leventis Ornithological Research Institute (APLORI), University of Jos Biological Conservatory, Jos, Nigeria
Deni Bown
Forest Unit, International Institute of Tropical Agriculture, Ibadan, Nigeria
Summary
The Ibadan Bird Club has met 19 times at monthly intervals between February 2016 and August 2017, and 264 people (155 male and 109 female) have registered as members. During this period, the club has successfully built local capacity in bird conservation, and 111 bird species, distributed in 39 families, have been documented in an urban Important Bird Area, southwestern Nigeria. The findings of this citizen science initiative are essential for conservation purposes.
Introduction
Conservation efforts produce remarkable results when stakeholders (landowners, indigenes, visitors, organizations and authorities) are involved in activities (Awoyemi et al. 2018). The stakeholders can contribute through citizen science, which is the collection of ecological data by members of the general public and non-specialists as part of scientific projects (Dickinson et al. 2012). This has been successful worldwide, especially in Australia (Tulloch et al. 2013), Europe (Silvertown, 2009) and North America (Dickinson et al. 2012), where enthusiasts, volunteers and nature lovers contribute data via bird and nature clubs. In some parts of Africa, citizen scientists now contribute data to bird atlas projects, which aim to map the distribution of birds in the continent (Hulbert, 2016; Ivande et al. 2017). The African Bird Club has taken this initiative by funding the establishment of bird clubs in Africa, notably the Ibadan Bird Club (IBC) (Demey, 2015).
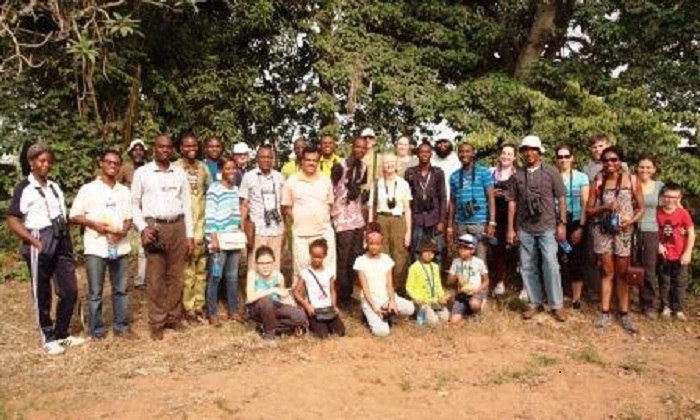
The IBC was started on 5 March 2014 by the Nigerian Conservation Foundation in partnership with the Department of Wildlife and Ecotourism Management, University of Ibadan, and the Forest Project at the International Institute of Tropical Agriculture (IITA), Ibadan, Nigeria (Demey, 2015). The aim was to build local capacity and enhance the conservation of birds in the Ibadan area. On 13 February 2016, the club was re-launched, so that it could be coordinated by the IITA Forest Unit as an activity of the A. G. Leventis-funded Ornithological Monitoring Project 2015-2017 (Figs. 1-3). The contributions of the club to bird conservation from then until August 2017 are presented here.
Fig 1. Re-launch of IBC, IITA, Ibadan, Nigeria, 13 February 2016 (Photo credit: Babajide Agboola)
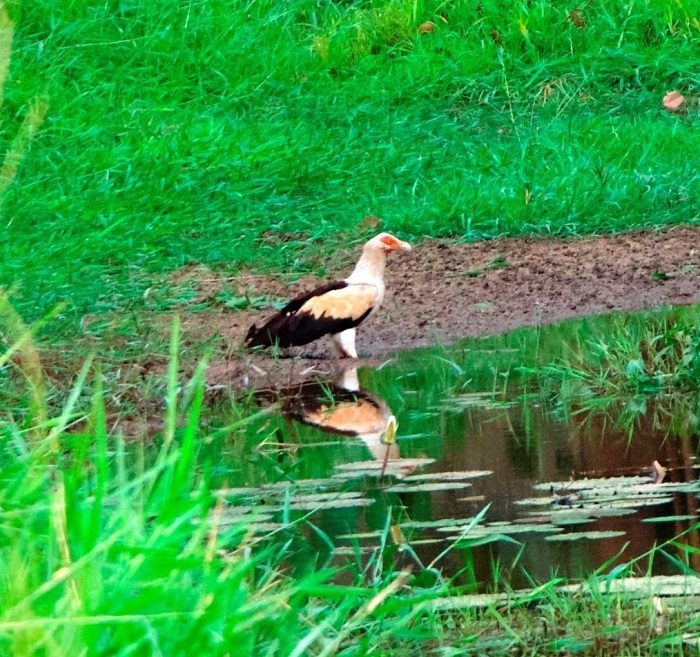
Fig 2. Palm-nut Vulture (Gypohierax angolensis) drinking water by the lake during IBC re-launch, 13 February 2016 (Photo credit: Andreas Gisel).
Fig 3. Wood Sandpiper (Tringa glareola) foraging in the IITA main reservoir during IBC re-launch, 13 February 2016 (Photo credit: Arvind Khebudkar)
Methods
Study area
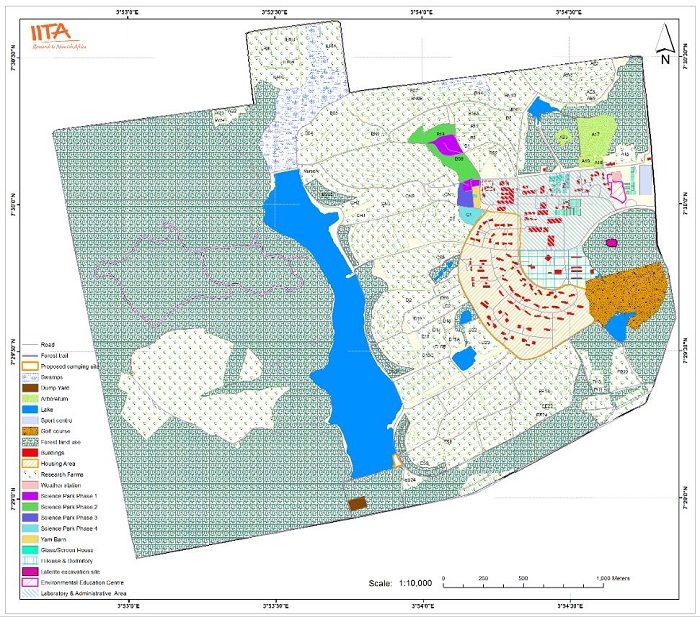
The activities of the IBC since its re-launch have been carried out within the IITA campus, Ibadan (7° 29’ N, 3° 54’ E; Fig. 4). The approx. 1000 ha campus is located in the transition zone between savannah and rainforest, and experiences two distinct seasons: wet (April-September) and dry (October-March) (Neuenschwander et al. 2015). The campus has different kinds of habitats (forests, wetlands, farmlands and gardens) and supports over 270 species of birds, which are either Afro-tropical residents or migratory (Ezealor, 2001; Adeyanju et al. 2014). The approx. 360 ha forest reserve within the campus is dominated by native trees such as , , and (Manu et al. 2005). It also holds 67 bird species that are restricted to the Guinea-Congo Forest Biome, qualifying it as an Important Bird Area (IBA) (Ezealor, 2001). It is our understanding that this is the only IBA in Nigeria located in a major conurbation, justifying the need for capacity building at the local level. The campus also contains a large reservoir, several lakes and a number of fishponds which constitute important habitats for waterbirds while crops such as banana, cassava, cowpea, maize, plantain, rice and yam are cultivated in the research farm.
Fig 4. Map of the IITA campus, Ibadan, Nigeria, May 2016 (Image credit: GIS Unit, IITA)
Data collection
The IBC has no badging but there is a unique structure that produces results. Typically an invitation, which contains a striking photo taken by a member, is sent at least 3 days before the new meeting date, which is fixed on the last Saturday of every month at 16h00 – 18h00. All levels of age, interest and experience are encouraged, and membership is free. Member attendance is noted and feedback is given in the form of short reports sent after each meeting while the members interact online via the club’s Facebook Group Page. Since the main focus of the club is capacity building, the coordinators (authors) normally stop at regular intervals to explain some aspects of avian ecology and the relevance of environmental education and citizen science to biodiversity conservation. The junior members of the club (IBC Juniors) are given high priority, and engaged in activities such as quizzes, debates, drawing contests, mist-netting and presentations in scientific workshops, in addition to birdwatching. In order to consolidate the knowledge gained during the meetings, club members are invited to workshops organised by the IITA Forest Unit Ornithological Monitoring Project on topics such as IBAs, Spring Alive and the World Migratory Bird Day.
Data were collected from February 2016 to August 2017 during meetings of the IBC. During this time, 19 meetings were held but data from 18 meetings (equally distributed between dry and wet seasons) were used in analysing our biological data as rain did not allow for a complete survey in June 2017 and the record was excluded. Therefore a total of 36 hours was spent during the meetings (survey). On arrival at the meeting venue, new members were normally introduced to the basics of birdwatching and use of equipment. Visits were then made to the three main habitats in the study area (farmland, forest and wetland), with each habitat receiving an equal number of visits (N=6). Line transects, measuring approx. 1.5 km were used to record all birds seen or heard during each walk (Bibby et al. 2000), though no fixed radius was set. There was no obvious change in vegetation during the data collection, therefore we did not measure vegetation variables but described the visited habitats as above. Consequently, we predicted that changes in bird encounter rate would be influenced mainly by habitat and season.
Data analyses
We calculated encounter rate as the number of species recorded per 2-hour survey (Guilherme, 2014), which was our response variable. We then graphically explored our dataset, and tested its normality using Shapiro-Wilk normality test: W = 0.654, p < 0.001. As this was not normally distributed even after transformation, we used Poisson Logistic Regression to test the difference in encounter rate between habitats and seasons in R statistical Software (R Development Core Team, 2013).
Furthermore, the species’ local abundance was estimated using this formula: (Ti/Tn) x 100; where Ti = number of transects along which a species was recorded, and Tn = the total number of transects surveyed (Asefu, 2015). We then classified species as common (observed on >75% of transects), frequent (observed on 50-74% of transects), uncommon (observed on 25-49% of transects) or rare (observed on <25% of transects) following Asefu (2015). We also assigned species to one of 3 major habitats (Redman et al. 2009; Borrow & Demey 2010): (1) aquatic species (wetlands, lakes and marshes); (2) forest species (closed forest); and (3) open habitat species (farmlands with scattered trees and grassland).
Results
Our sociological data reveal that 264 people have registered as members of the IBC since its re-launch. Among these were 155 male (59%), 109 female (41%) and 27 juniors under the age of 12 years (10%). The club has been consistent in its activities, and an average of 31 members attends the monthly meetings.
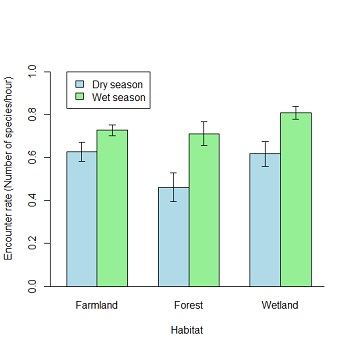
Biologically, 111 bird species belonging to 39 families were recorded during the survey; their relative frequency, status, biomes and habitat requirements are listed in Appendix 1. Among these were 21 species restricted to the Guinea-Congo Forests Biome, 1 species restricted to the Sudan-Guinea Savannah Biome, 7 Palaearctic migrants and 16 Intra-African migrants, while the rest were resident (Appendix 1). This diversity of birds may be attributed to the different kinds of habitats found within the study area, which allows birds to exploit them differently. For instance, all the 21 species restricted to the Guinea-Congo Forests Biome were recorded within the forest reserve, the yellow-billed shrike (restricted to the Sudan-Guinea Savannah Biome) was recorded only in farmlands, while the palaearctic and Intra-African migrants mainly utilized farmlands and wetlands. Poisson Logistic Regression shows that bird encounter rate significantly differs between habitats and seasons (Table 1; Fig. 5).
Parameters
Estimate
Error
z
p
Intercept
0.52325
0.09622
5.438
<0.001
Habitat (forest)
-0.07696
0.13472
-0.571
0.568
Habitat (wetland)
0.46761
0.12348
3.787
<0.001
Season (wet)
0.45689
0.11568
3.949
<0.001
forest x wet
-0.60378
0.19041
-3.171
<0.001
wetland x wet
-0.51344
0.15644
-3.282
<0.001
Fig 5. Differences in encounter rate between habitats and seasons
Discussion
Effective conservation of biodiversity largely depends on the involvement of stakeholders. Our findings have revealed that their involvement increases the appreciation of the natural world. If well-engaged, they can also contribute data which are essential for formulating conservation strategies as presented here. The IBC has successfully raised awareness about bird conservation and engaged citizen scientists. The club has attracted the attention of indigenes, visitors/tourists, enthusiasts, professionals, researchers and students, who in turn disseminate the knowledge gained from the club to a wider audience such as colleagues, families and friends. In addition, the influence generated online via the Facebook Group Page is producing positive cascading effects. Worthy of note is the performance of the IBC Juniors whose age averages 9 years. Children learn quickly at tender ages, and we have maximized this opportunity to inculcate environmental and conservation values in them. It is anticipated that both the values and practical skills will provide a worthwhile basis for their contributions to society as citizens of the future.
Given the focus of this study, which is citizen science, our biological data undoubtedly under-estimate bird diversity in the study area (see Adeyanju et al. 2014). It is also important to note that we were more interested in the number of species encountered per habitat but the fact that more birds were encountered in a certain habitat does not imply it is richer. In addition, the survey was carried out towards late afternoon, implying that we have missed out on some birds at dawn. Nevertheless, the study has added to the goal of constant monitoring of birds and habitats, and local capacity has been built. In addition, our study has affirmed the ornithological significance of the study area by recording 21 out of the 67 bird species that qualify the IITA Forest Reserve as an IBA (Ezealor, 2001). The yellow-billed shrike , a species restricted to the Sudan-Guinea Savannah Biome was recorded during our expeditions. Although this is hardly surprising due to the location of the study area in the transition zone between the forest and savannah (Neuenschwander et al. 2015), this might also provide a clearer indication of savannah encroachment into the forest zone. By occurring in nearly all the habitat types, three species were the most commonly recorded throughout the survey: red-eyed dove (18/18), African pied hornbill (17/18) and pied crow (16/18).
Interestingly, more birds were encountered in the wet than dry season in all three habitats (Table 1; Fig. 5). On the one hand, this may be due to the influx of migratory birds at the end of the wet season in August and September as the study area serves as an important wintering ground for Palaearctic migrants. On the other hand, it may be due to the recruitment of new individuals as most Afro-tropical resident birds are known to breed during the wet season when food is plentiful (Elgood et al. 1994). As IITA is an agricultural research institute, mechanized farming is carried out within the campus. During two of our bird walks during the wet season, over 50 birds at a time were noted intensively foraging behind tractors as they ploughed in the research fields. This might account for the higher number of birds recorded in this habitat during the wet season. In addition, we also noted that heavy downpours caused some lakes to overflow their banks. While this may appear hazardous, receding water increases the concentration of prey available to birds foraging along water bodies (Cumming et al. 2012).
In conclusion, we have provided evidence that environmental education via bird clubs is vital for bird conservation. Our findings from the citizen science data presented here may be the first in Africa and, given the rate at which habitats are lost due to anthropogenic activities, environmental education and citizen science are particularly important now. Although the activities of the IBC were restricted to the IITA campus during this reporting period, plans are underway to replicate activities in other areas around Ibadan. We will also endeavour to get more birdwatching equipment and materials (binoculars, telescopes, cameras, bird song recorders and guidebooks) to better serve the average number of members we expect at monthly meetings.
Acknowledgements
Authors are grateful to the following people and organizations: all IBC members who supported the activities of the club; Chima Nwaogu and Sam Ivande advised on statistical analyses; Shiiwua Manu and Phil Hall commented on an earlier draft; the AG. Leventis Foundation funded the IBC as part of the Ornithological Monitoring Project, and IITA-Ibadan hosted the activities of the club. This is publication number 146 from the A. P. Leventis Ornithological Research Institute (APLORI), Jos, Nigeria.
References
Adeyanju TA, Ottosson U, Adeyanju T, Omotoriogun T, Hall P, Manu S, Alabi T, Lameed G, and Bown D. 2014. Birds of the International Institute of Tropical Agriculture campus, a stronghold of avian diversity in the changing Ibadan area (Nigeria) over the last 50 years. Malimbus 36:76-105.
Asefu A. 2015. Bird observations in Muktar Mountain Forest, eastern Ethiopia: a previously unidentified Important Bird Area. Bulletin of the African Bird Club 22(1):36-42.
Awoyemi AG, Bown D, Manu S, Ajayi A, Olasupo O, and Olubodun O. 2018. First breeding record of Ahanta Francolin Pternistis ahantensis for Nigeria. Bulletin of the African Bird Club 25(1):70-71.
Bibby CJ, Burgess ND, and Hill DA. 2000. Bird census techniques. London: Academic Press.
Borrow N, and Demey, R. 2010. Birds of Western Africa. Christopher Helm, London.
Cumming GC, Paxton M, King J, and Beuster H. 2012. Foraging guild membership explains variation in waterbird responses to the hydrological regime of an arid-region flood-pulse river in Namibia. Freshwater Biology 57:1202-1213. https://doi.org/10.1111/j.1365-2427.2012.02789.x
Demey R. 2015. Volunteers for bird conservation. Bulletin of the African Bird Club 22(1):11.
Dickinson JL, Shirk J, Bonter D, Bonney R, Crain RL, Martin J, Philips T, and Purcell K. 2012. The current state of citizen science as a tool for ecological research and public engagement. Frontiers in Ecology and the Environment 10(6):291-297. https://doi.org/10.1890/110236
Elgood JH, Heigham JB, Moore AM, Nason AM, Sharland RE, and Skinner NJ. 1994. The birds of Nigeria: an annotated check-list (2nd edition). The Natural History Museum, Tring, Herts HP23 6AP, UK.: British Ornithologists’ Union.
Ezealor EA. 2001. Nigeria. In Fishpool LDC, and Evans MI (eds.). Important Bird Areas in Africa and Associated Islands: Priority Sites for Conservation. Newbury: Pisces Publications and Cambridge, UK: BirdLife International.
Guilherme JL. 2014. Birds of the Boe region, south-east Guinea-Bissau, including the first country records of Chestnut-backed Sparrow Lark Eremopterix leucotis, Lesser Striped Swallow Cecropis abyssinica and Heuglin’s Wheatear Oenanthe heuglini. Bulletin of the African Bird Club 21(2):155-168.
Hulbert J. 2016. Citizen science tools available for ecological research in South Africa. South African Journal of Science 112(5/6):1-2.
Ivande ST, Talatu T, and Ottosson U. 2016. Nigeria Bird Atlas Project: how far so far? progress report august 2016. Biodiversity Observations 7(50):1-3.
Manu S, Peach W, Bowden C, and Cresswell W. 2005. The effects of forest fragmentation on the population density and distribution of the globally Endangered Ibadan Malimbe Malimbus ibadanensis and other malimbe species. Bird Conservation International 15:275-285. https://doi.org/10.1017/S0959270905000444
Neuenschwander P, Bown D, Hèdégbètan GC, and Adomou A. 2015. Long-term conservation and rehabilitation of threatened rain forest patches under different human population pressures in West Africa. Nature Conservation 13:21-46. https://doi.org/10.3897/natureconservation.13.6539
R Development Core Team. 2013. R: A language and environment for statistical computing. R Foundation for Statistical Computing, Vienna, Austria. ISBN 3-900051-07-0, URL http://www.R-project.org/.
Redman N, Stevenson T, and Fanshawe J. 2009. Birds of the Horn of Africa. London, UK: Christopher Helm.
Silvertown J. 2009. A new dawn for citizen science. Trends in Ecology and Evolution 24(9):467-471.
Tulloch AIT, Possingham HP, Joseph LN, Szabo J, and Martin TG. 2013. Realising the full potential of citizen science monitoring programs. Biological Conservation 165:128-138. https://doi.org/10.1016/j.biocon.2013.05.025
Greedy southern pale chanting goshawk Melierax canorus
Ursula Franke-Bryson
Tal 34, Munich, Germany
Summary
Southern pale chanting goshawks (Melierax canorus) never miss an opportunity for feeding on any creature living or dead. Here three birds are recorded with the beak or crop still full, and hunting techniques and diet are described.
Introduction
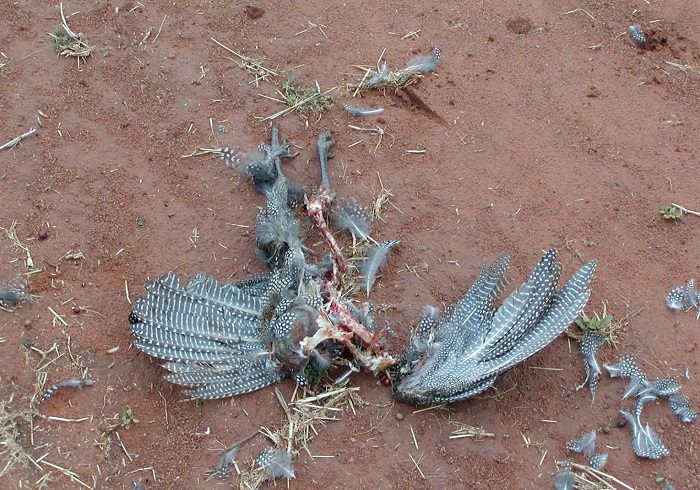
Southern pale chanting goshawk hunting skills encompass a great variety of techniques. They hunt alone or in groups. They mainly hunt smaller prey, but are capable of killing animals heavier than themselves. The local available biodiversity determines the composition of the diet, which is generally highly diverse. Among recorded prey items are mammals (mainly rodents), birds (a variety of species ranging from larks, swallows, weavers to the size of francolin, korhaan, sandgrouse, owls and guineafowl) (Malan and Crowe 1996). Predation records have included a stunned rock kestrel or sometimes chickens (Steyn 1982). Southern pale chanting goshawks have also been recorded predating reptiles, amphibians, and invertebrates (sunspiders, harvester termites, grasshoppers, beetles and other insects). Southern pale chanting goshawks also feed on carrion of any kind, from hares to owls (Stein 1982; Biggs et al. 1984; Malan and Crowe 1996; Allan 2005). In one incident they might have detected a carcass of an Egyptian goose (Alopochen aegyptiaca) by observing Cape crows (Corvus capensis) gathering nearby (Ryan et al. 2012).
Steyn (1982) reports lizards as the most common prey in Kenya, while a study in the Western Cape Province, South Africa, found that more than 90% of the diet consisted of three species of rodents: Karoo bush rat (Myotomys (Otomys) unisulcatus), Brants’ whistling rat (Parotomys brantsii) and four-striped grass mouse (Rhabdomys pumilio) (Malan and Crowe 1996). Malan (2017) found leopard tortoise (Stigmochelys pardalis) hatchlings being preyed upon, but only in their first two weeks while their carapaces, the outer shells, were still soft. In the arid savannah near Usakos, Namibia, (22° 24’S; 15° 25’E), I once saw two juvenile southern pale chanting goshawks, in the presence of one adult, dropping down clumsily on three young bat-eared foxes (Otocyon megalotis) who made it in time to their distant underground den, while the adult fox was defensively snapping into the air towards the attacking birds. It is unclear whether this behaviour was curiosity, hunting instinct, honing the hunting skills of the juveniles, or a serious attempt at predation in the harsh environment.
Southern pale chanting goshawks perch high up to swoop down on prey and may pursue their prey swiftly on foot, if needed. They run so “blisteringly fast with these long legs” that “they easily can catch a sunspider” (Malan 2017). In strong wind, hunting may be restricted to the ground (pers. obs.). Although most prey are caught on the ground, birds can also be predated in flight, as Steyn (1982) observed during predation on a crowned plover (Vanellus coronatus) and a harlequin quail (Coturnix delegorguei).
Southern pale chanting goshawks are also known to take advantage of the hunting skills of other animals, and follow mammals (mainly honey badger, Melivora capensis, and slender mongoose, Galerella sanguinea), other birds, and possibly rock monitors (Varanus albigularis), who all could flush prey by their presence, by digging and exploring holes. Pale chanting goshawks have been sighted hoping for secondary prey from a Cape cobra (Naja nivea) (Siebert and Siebert 2003; Vanderwalt 2016), and kleptoparasitising a booted eagle (Hieraaetus pennatus) (in Malan 1998, p. 199) and a pipit from a kestrel (Steyn 1982).
Observation
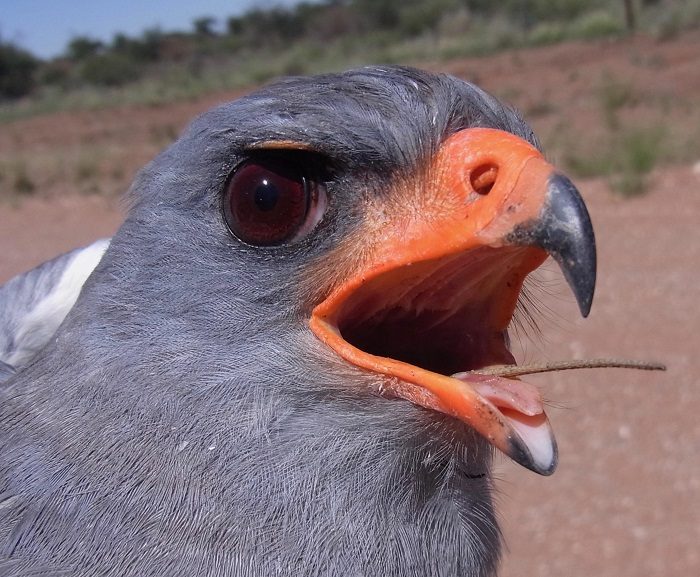
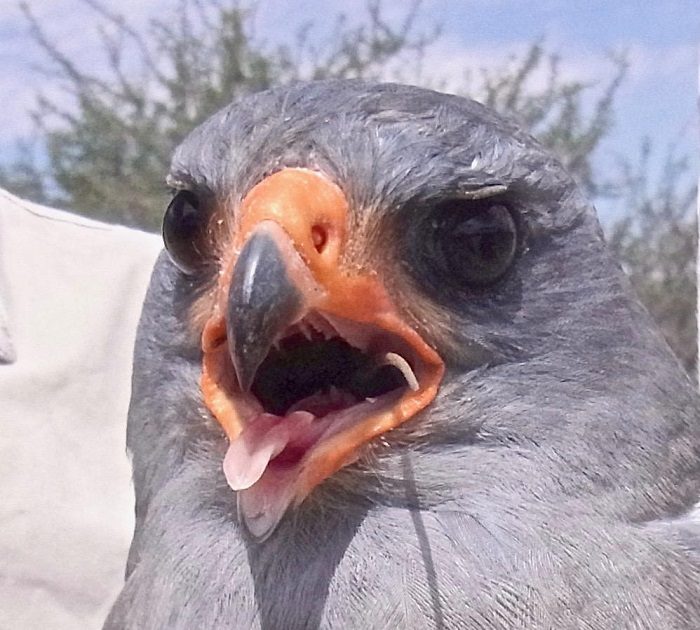
We have caught two different southern pale chanting goshawk individuals, which had swallowed lizards directly before our observations – the tail of a lizard was still sticking out of the throat when each came swooping down to its next prey in the form of a mouse in a trap (Figures 1 and 2). Bird ringers might have experienced that a southern pale chanting goshawk will repeatedly try to take the bait whenever an attempt (or more) of catching the bird with a bal-chatri trap has failed. A bal-chatri is a cage containing a live rodent used to attract the attention of the raptor, and with nooses or fishline on top of the cage to entangle the raptor’s feet when landing and trying to catch the bait (de Beer 2001).
Adult female, the tail of a lizard still sticking out of her beak. Safring ring number 723669, ringed north of Witvlei, Namibia (22 deg 24’S; 18 deg 30’E).
Adult male, the tail of a lizard still sticking out of his beak. Safring ring number K34924, ringed near Omitara, Namibia (22 deg 21’S; 17 deg 40’E).
A further adult female was trapped and ringed coming straight from a fresh helmeted guineafowl (Numida meleagris) kill. All flesh had been consumed. The southern pale chanting goshawk came to the bal-chatri already with a huge crop (Figures 3 and 4). As the site was near a gravel road, it remains unclear whether the southern pale chanting goshawk had killed the guineafowl or whether it had been hit by a car.
A bulging crop which contains a helmeted guineafowl, Limpopo Province, South Africa. (Photo credit: Lyn Williams)
The remains of the helmeted guineafowl. (Photo credit: Lyn Williams)
Acknowledgements
I am grateful to Susan Mvungi from the Niven Library, Percy FitzPatrick Institute of African Ornithology, University of Cape Town, for supporting me with access to literature, and to Dane Paijmans for revising the text.
References
Allan DG 2005. Southern Pale Chanting Goshawk. In: Hockey PAR, Dean WRJ, Ryan PG (eds). Roberts Birds of Southern Africa. 7th Ed. The Trustees of the John Voelcker Bird Book Fund, Cape Town. pp 509-511.
de Beer SJ, Lockwood GM, Raijmakers JHFA, Raijmakers JMH, Scott WA, Oschadleus HD, Underhill LG 2001. SAFRING bird ringing manual. 2nd Ed. Animal Demography Unit, Cape Town.
Biggs HC, Biggs R, Freyer E 1984. Observations on the Chanting Goshawk Melierax canorus during a period of poor rainfall. Proceedings of the Second Symposium on African Predatory Birds 61-70. Natal Bird Club, Durban.
Ferguson-Lees J, Christie DA 2001. Raptors of the world. Christopher Helm, London. pp 512-513.
Kemp AC, Kirwan GM 2017. Pale Chanting Goshawk Melierax canorus. In: del Hoyo J, Elliott A, Sargatal J, Christie DA, de Juana E (eds). Handbook of the Birds of the World Alive. Lynx Edicions, Barcelona. Available from http://www.hbw.com/node/53039 (Accessed on on 29.10.2017).
Malan G 1998. Solitary and social hunting in Pale Chanting Goshawk Melierax canorus families: why use both strategies? Journal of Raptor Research 32:195-201.
Malan G, Crowe TM 1996. The diet and conservation of monogamous and polyandrous Pale Chanting Goshawks in the Little Karoo, South Africa. South African Journal of Wildlife Research 26:1-10.
Ryan PG, Shaw JM, van der Merwe R, van der Merwe E 2012. Carrion attraction: goshawks and other birds captured on camera traps. Ornithological Observations 3:102-106. Available from http://bo.adu.org.za/content.php?id=49 (Accessed on on 29.10.2017).
Siebert S, Siebert P 2003. Pale Chanting Goshawk following Cape Cobra. Promerops 254:19.
Steyn P 1982. Birds of prey of Southern Africa. Their identification and life histories. David Philip, Cape Town. pp 183-186.
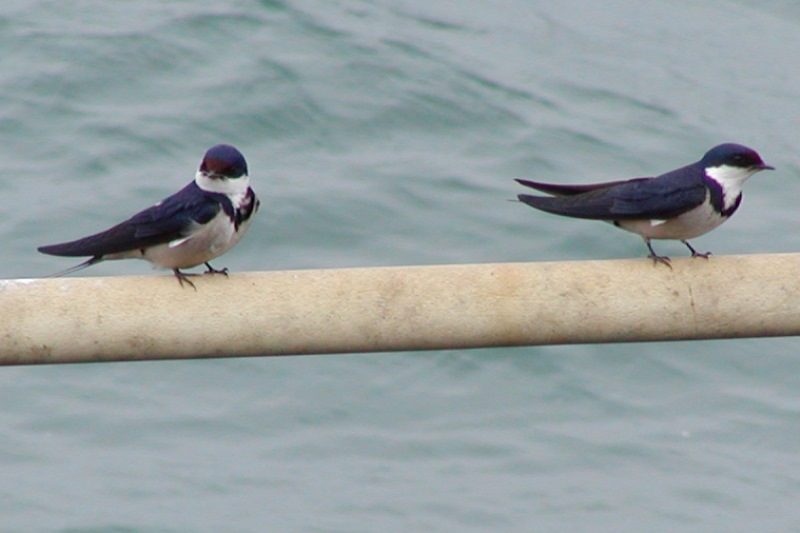
White-throated Swallows are common in Cape Town in the summer months, building their nests under the multiple bridges that cross canals and rivers. They migrate north in Africa to escape the wet Cape Town winter.
Ringing of these swallows (both adults and nestlings) has been opportunistic most of the time, while ringing weavers in wetlands around Cape Town. Nevertheless, some interesting data has been obtained. Most chicks were ringed in October and November, matching the peak of October to December. Brood size varied from 2 to 4 (average 2.8) – this compares with published clutch size of 2-5 (mean 3.2), suggesting a small mortality of eggs laid to chicks fledged.
One adult White-throated Swallow was recaptured 3 years later and another 2 years later, and two others a few months later. All recaptures were in the same area, suggesting a high site fidelity in this species. None of the 33 chicks ringed has been recaptured to date.
The range and numbers of this species have increased in the Western Cape due to the widespread availability of impoundments and structures that can be used as nesting sites. The White-throated Swallow could be an interesting subject of more detailed studies.
Pair-of-adult-White-throated-Swallows in Cape Town


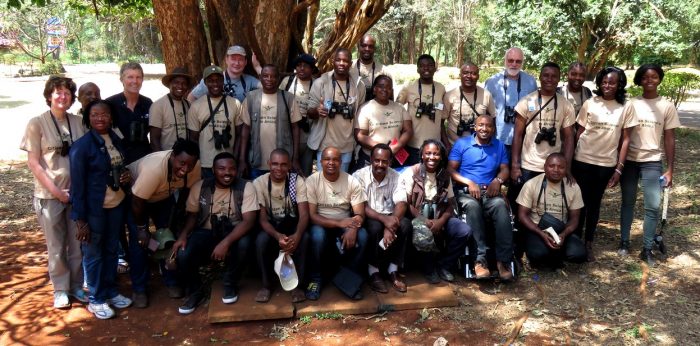
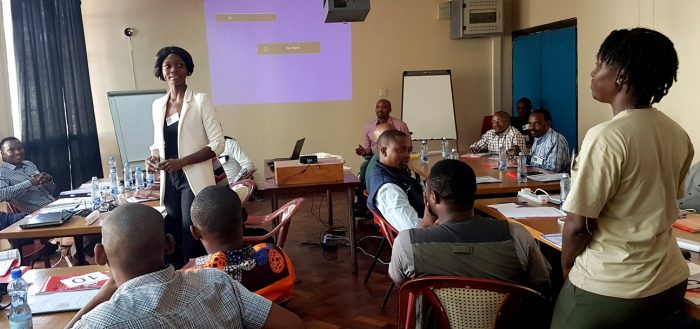
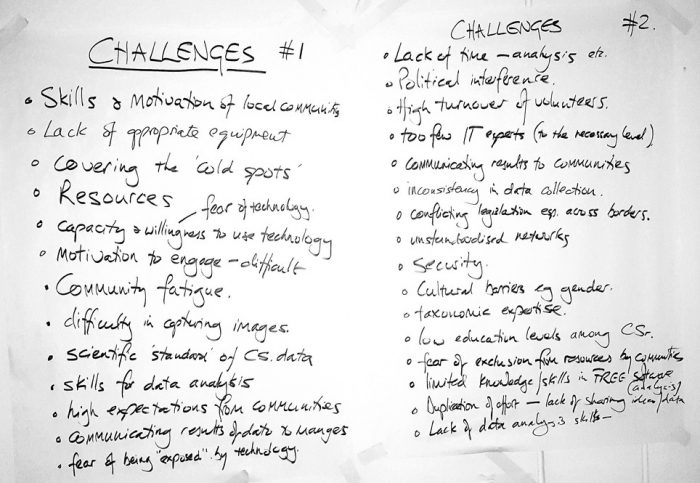
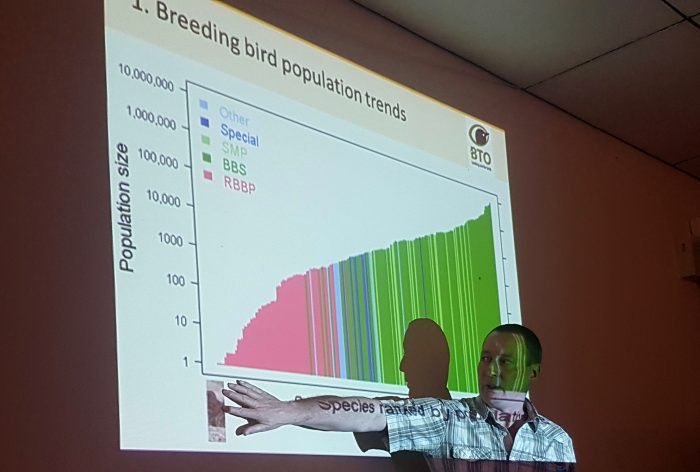
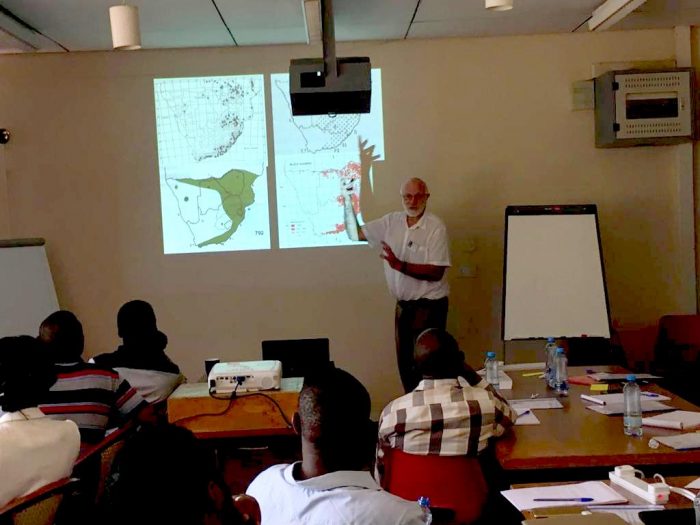

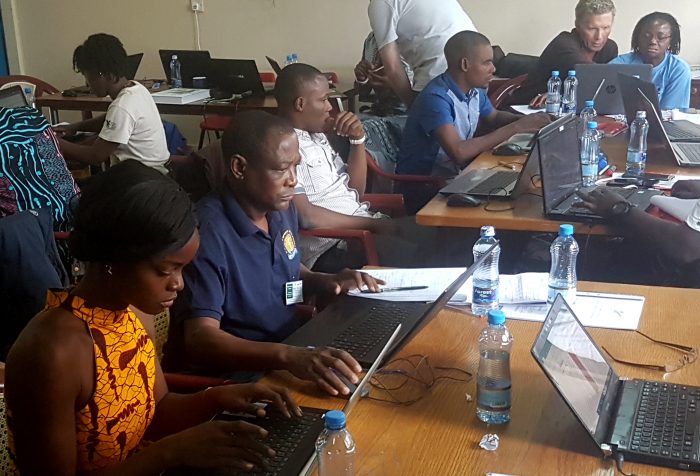
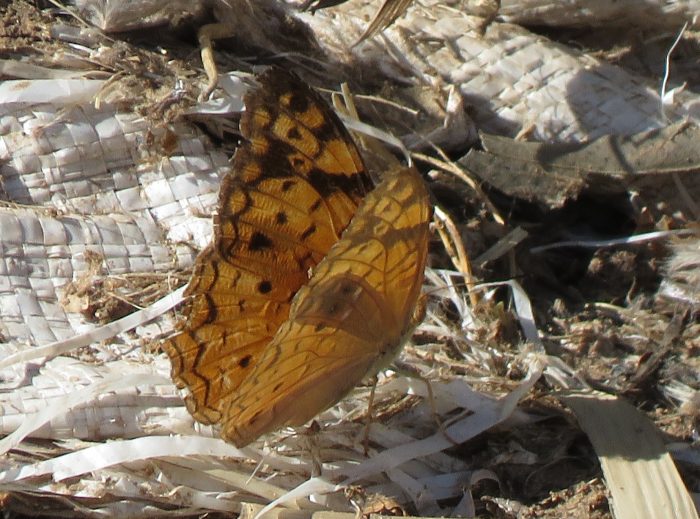

 One of the participants on the course was Laban Njoroge, who is the entomologist at the museum. The museum’s collection of insects was on the same floor as our course venue, so Laban had the shortest distance between his office and the course! In the course WhatsApp group, Laban told us about the Jackson whose name is attached to this chameleon: “This man Jackson was a seasoned and passionate naturalist. In one of the AGMs of the then East African Natural History Society (now Nature Kenya, Nature Uganda and Nature Tanzania) he came up with an idea of making natural history collections. To kick start his idea he donated a drawer of butterflies. This is how the huge insect collection at National Museums of Kenya was started. This drawer still remains in our collection to date.”