Five days in the Northern Cape with a team of avid birders?! It sounds like a dream come true, and for me, that dream recently became a reality. Wednesday, June 12, a team of six citizen scientists (Jerome Ainsley, Chris Cheetham, Tino Herselman, Salome Willemse, Les Underhill, and myself) gathered in Handvol Gruis guesthouse near Calvinia in the Northern Cape for a 5-day BioBash. The previous BioBash here had been in midsummer. From Wednesday through Sunday, we aimed to explore as many pentads and grid cells in the surrounding area as deeply as we could. Though primarily searching for birds, we also took time to peek under rocks for scorpions and snap photos of passing springbok for the Virtual Museum. While, Jerome, Chris, Tino, and Salome focussed on atlasing for SABAP2, Les and I used the trip to collect VM data.
A personal highlight, though, was Layard’s Tit-babbler—not a particularly uncommon species, but notoriously difficult to see and photograph. With a bit of patience, this one eventually emerged from its bush and perched just long enough for a BirdPix photo.
Among a bevy of larks, chats, canaries, and other common karoo residents, we did have a few surprising finds as well. One of these was a population of Cape Sugarbirds spotted by Chris, quite far north of their expected occurrence. We also encountered a Goliath Heron far out of its typical range!
Though each day held its triumphs, these were often overshadowed in my mind by a sense of loss. On the drive up to Calvinia, we passed a dry riverbed labelled “Droge leegte”, “Dry Void”. Driving through the karoo or even looking at a satellite image of the region, those two words seem apt descriptors for much of the landscape. The karoo farmland has been devastated by drought and overgrazing in the past decades, and local farmers are struggling to raise crops and livestock. These time-lapse images from Google Earth Engine show the changes in the landscape between 1984 and 2018.
Time-lapse images of Calvinia and surrounding region. To view the years in between or play the full time-lapse, follow the link on the photo.
As we connected with landowners and farmers along our routes, conversations constantly revolved around rainfall. We spoke to the owner of a sheep farm near Nieuwoudtville, who shared that their land received only 4 millimetres of rain in 2018. The difficult reality is that in many ways, this ecosystem is dying. Overgrazing has left its nutrients depleted beyond hope of restoration, and the warming climate brings less and less vital rain each year. As a result, those who do live on the land are faced with the difficult choice of either struggling to continue farming, or leaving their homes, often of generations, to start over again elsewhere.
Sheep on a farm near Doringbos.
On the first day of data collection, we witnessed both of these outcomes. On a remote but active farm, Salome and I encountered sheep that were starving, unable to subsist on what little vegetation remained. We also passed homes that were abandoned; drapes still hanging in the windows, goldfish still swimming in the pond. Throughout the week, these eerily quiet scenes served as the sobering backdrop to our work, reminders of the severity of the drought and the effects of unsustainable land use.
Chris Cheetham searches for birds at an abandoned farmhouse near Loeriesfontein.
In spite of the hardship, I was struck by the resilience and kindness of the people we met. Residents readily connected to us through a mutual love of the land and the life it sustains, and were quick to offer information on the species they had encountered, the best locations to spot raptors, which roads to avoid, and more.
My takeaways from this (my first!) BioBash are twofold: I am deeply aware of the challenges facing this region of the country, but am also encouraged by the impact one small group can make in such a short period of time. Over the course of the week, the atlasing team (Salome, Chris, Jerome, and Tino) contributed 55 cards to SABAP2, and between Tino, Salome, Les, and myself, 840 records were added to BirdPix! The BirdPix additions are clearly visible in this map of the Namakwaland district municipality, which shows the number of species recorded in each quarter degree grid cell prior to and following the BioBash*. The diagram in the lower left corner shows the location of Calvinia (quarter degree grid cell 3119BD).
*The new map is not entirely up-to-date, as records are still being identified by the BirdPix team. It will be replaced with an updated map once all species ID’s have been confirmed.
To me, this success is just another beautiful reminder of conservation without borders: unique people united by a shared passion for the world around us. Even within our team, the diversity was incredible—we were a group comprised of statisticians, scientists, accountants, nature guides, craftsmen, and more! We need individuals from all backgrounds, disciplines, and cultures to generate strong and lasting conservation action, and projects like this are brilliant examples of what effective collaboration can achieve.
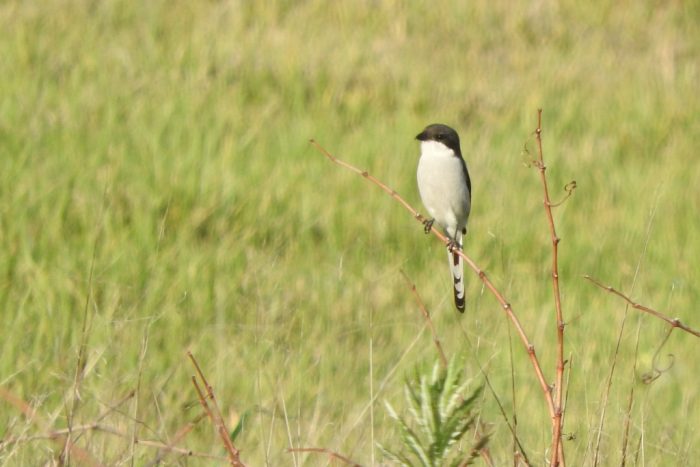
Bird ringing was conducted at Fynbos Estate from 17-21 June 2019, with two students from France, as part of their field project. During the ringing sessions Emilie and Manon learned to identify and measure local bird species. Two species, Common Fiscals and Cape Robin-chats, were also colour ringed to enable observations on individually identifiable birds. During ringing sessions, territories of at least two pairs of Common Fiscals were noted. The Common Fiscals at Fynbos Estate often hunt from surprisingly low perches in the vineyards.
Cape Robin-chat
Common Fiscal
Table: Number of birds ringed and recaptured at Fynbos Estate, 17-21 June 2019
Species
English
Ringed
Recaptured
Total
316
Cape Turtle Dove
1
0
1
391
White-backed Mousebird
1
0
1
432
Acacia Pied Barbet
0
3
3
440
Greater Honeyguide
1
0
1
543
Cape Bulbul
5
0
5
581
Cape Robin-chat
6
1
7
621
Long-billed Crombec
1
0
1
622
Bar-throated Apalis
3
0
3
665
Fiscal Flycatcher
1
0
1
672
Cape Batis
2
0
2
678
Fairy Flycatcher
1
0
1
707
Common Fiscal
3
1
4
751
Malachite Sunbird
1
2
3
786
Cape Sparrow
1
0
1
799
Cape Weaver
76
11
87
803
Southern Masked Weaver
13
6
19
808
Southern Red Bishop
1
0
1
810
Yellow Bishop
6
0
6
1105
Olive Thrush
2
1
3
1172
Cape White-eye
32
6
38
4139
Karoo Prinia
3
2
5
4142
Southern Grey-headed Sparrow
2
0
2
TOTALS
162
33
195
Close to 200 birds were caught and processed. Recaptures included birds from the first ringing trip to Fynbos in May 2018. 22 species were handled, including three species not recorded here before: Greater Honeyguide (an immature male), Long-billed Crombec and Fairy Flycatcher. The Greater Honeyguide is a brood parasite of hole nesting birds like woodpeckers and barbets and potential hosts at Fynbos are Cardinal Woodpecker and Acacia Pied Barbet.
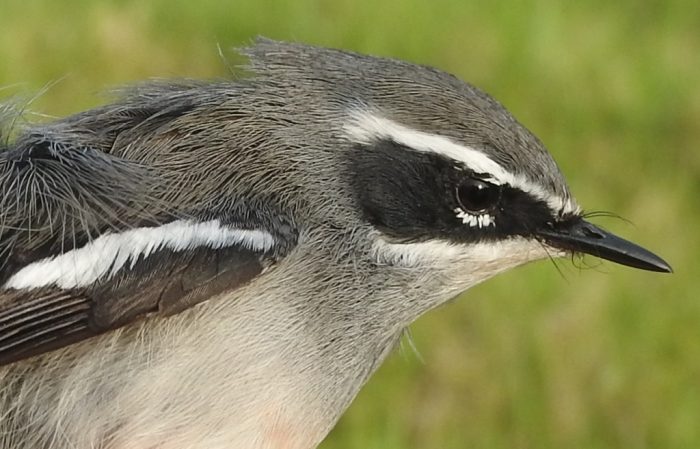
There are 14 species of Cossypha robin-chats in Africa. They are medium sized thrushes and sexes are alike. They have much red in the plumage and many species have a white eyebrow. The juveniles are spotted above and mottled below, but the tail pattern is the same as that of the adults. These birds have long tarsi and are usually found on or near the ground in forest or thickets, although some species occur in gardens that are near well wooded areas. They are most active at dawn and dusk, and are accomplished songsters and often mimic the calls of other species.
White-throated Robin-Chat
The Chorister Robin-Chat has the greatest longevity at 24 years, based on a recapture of a colour ringed bird (read story here). The Cape Robin-chat has been well ringed and has a high longevity of 17 years (see Table below). The other South African robin-chats have lower ringing rates, but still high longevities at 9 years or more. The other African robin-chats have very low ringing totals with SAFRING rings, but there are probably many more ringed for the Kenyan species.
Cape Robin-chat
The Birds of Africa handbook (Vol 4, 1992) provides two additional longevity records from various published studies. In Malawi the Olive-flanked Robin was recorded with a longevity of over 10 years. In Kenya a Blue-shouldered Robin-Chat had a longevity of 8 years (and there is a record of 24 years of a bird in captivity).
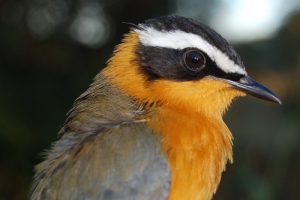
White-browed Robin-Chat
Many more longevity records are to be expected from this well loved group of birds, as more of them are ringed!
Red-capped Robin-Chat
Table. Number of robin-chats ringed and longevity records from SAFRING database, data extracted 7/06/2019
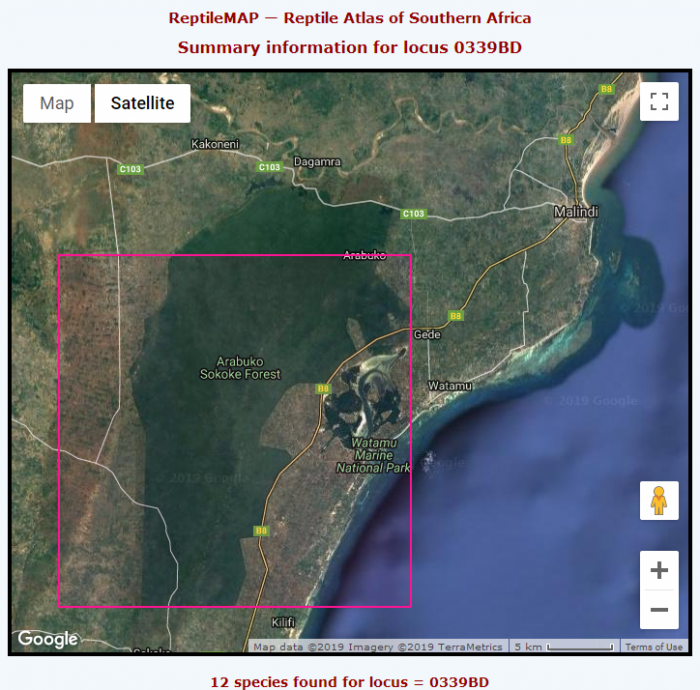
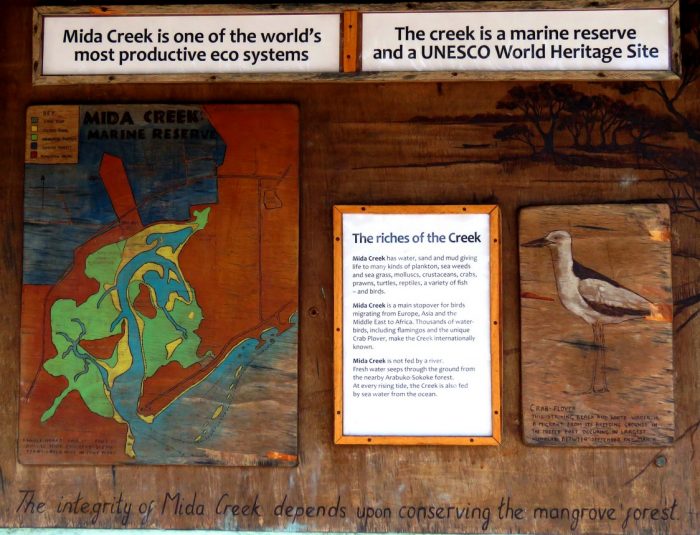
Mwamba is the Conservation Centre of A Rocha Kenya. It is on the coast, and offshore is the Watamu Marine National Park. Just inland is the Arabuko-Sokoke Forest, the largest remnant of a dry coastal forest which originally stretched from Somalia to Mozambique. Just to the south of Mwamba lies Mida Creek, which has mangrove forests, intertidal sandflats and lots of waterbirds, especially migrant waders. The Mwamba Conservation Centre is a superb resource for conservationists, researchers, students, community groups and even holiday makers. Over the years, it has developed a smorgasbord of practical conservation programmes; there are initiatives in scientific research, environmental education and community conservation.
The Mwamba Conservation Centre is just inside the eastern boundary of quarter degree grid cell 0339BD, more or less under the U in the label for the Watamu Marine National Park. The boundaries of the Arabuko-Sokoke Forest are clearly shown in the Google image. Mida Creek lies between the forest and the sea. If you arrive by air, you fly into Malindi, near the northeastern corner of the map. About 100 km to the south is Mombasa.
In a place abounding with biodiversity, it was a great chance to make a contribution to the Virtual Museum. This blog is a small sample of the records.
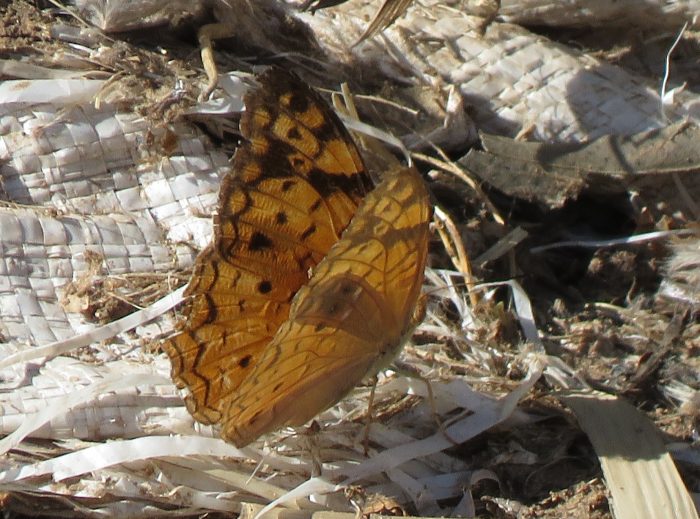
This unassuming butterfly is the African Migrant Catopsilia florella. As its name implies this is a migrant butterfly, but (like the Brown-veined White Belenois aurota) the migrations are one-way! It occurs through most of Africa. There are currently 3,982 records of this species in LepiMAP, the Atlas of African Lepidoptera. But we need a lot more records to be able to produce a respectable distribution map. This record is at http://vmus.adu.org.za/?vm=LepiMAP-679725.
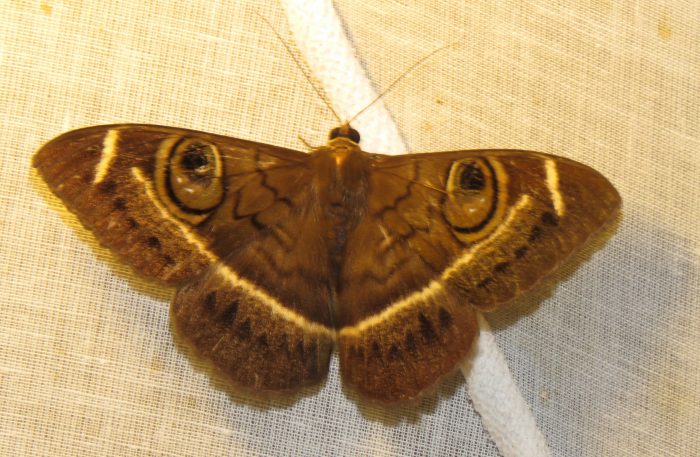
While I was at Mwamba, the commonest moth by far was Cyligramma latona. This moth is so well-known and widespread that it has an English common name: Cream-striped Owl. This large moth has a wingspan of about 80 mm. This “specimen” is curated in the Virtual Museum at http://vmus.adu.org.za/?vm=LepiMAP-679318. It was the first record of the species in quarter degree grid cell 0339BD. Currently 71 species of Lepidoptera (moths and butterflies) have been LepiMAPped for this grid cell. The full list is here http://vmus.adu.org.za/vm_locus_map.php?vm=lepimap&locus=0339BD. Colin Jackson says that 125 species of butterflies (let alone moths) have been recorded on the Mwamba property alone and that the Arabuko-Sokoke Forest is an even more magnificent destination for the lepidopterists.
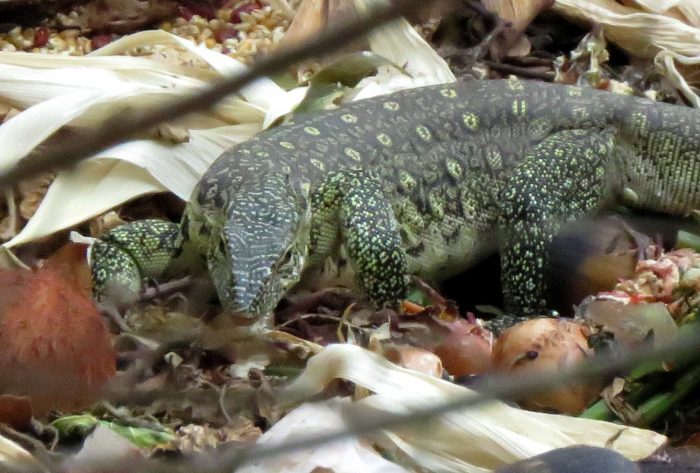
On to reptiles! The Mwamba Conservation Centre has a designated “compost heap”. I am doubtful about the amount of compost produced … because it actually serves as the dining room table for …
The grounds of the Mwamba Conservation Centre are similar to the others along this piece of coastline: about 4 ha in area, long, thin rectangles with about 100 m along the shore, and stretching back about 400 m to a main road parallel to the shore. Most of the area, across all the properties, is natural coastal vegetation, and it is used by birds as a coastal highway. Colin has set up a few mistnetting sites at right angles to the coast, and runs a regular bird-ringing programme that monitors coastal passage. One of these ringing sessions took place while I was there.
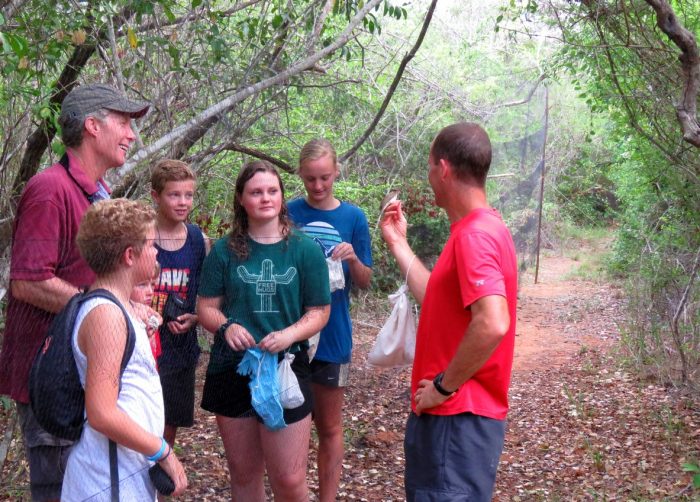
Bird ringing demonstrations have a long history of making people of all ages passionate about birds. Here, Jeff Davis, who teaches biology at the Rift Valley Academy, discusses the bird that he has just removed from the mistnet with the young people who were staying at the Conservation Centre at the time.
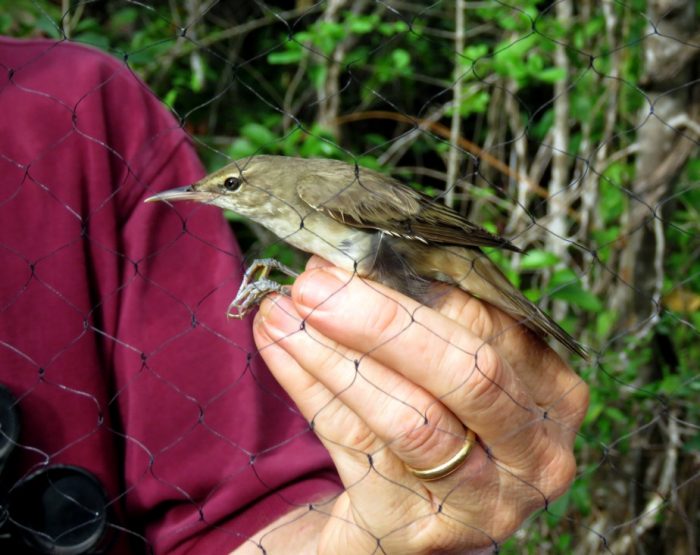
This bird left Colin amazed. It was the first Basra Reed Warbler Acrocephalus griseldis ever recorded at Mwamba. Its threat status is Endangered. This migrant has a large non-breeding range stretching from the Horn of Africa to Mozambique. But it has a minute and shrinking breeding range in the Mesopotamian marshes of southern Iraq (amazingly, a few were found breeding in a reedbed in Israel in 2006). This bird (but not this photograph) is curated in the BirdPix section of the Virtual Museum at http://vmus.adu.org.za/?vm=BirdPix-75886.
This is an (Asian) Lesser Cuckoo Cuculus poliocephalus. It has an unusual migratory pattern. This cuckoo breeds from Afghanistan, along the southern foothills of the Himalayas, in southern China and eastwards to Japan! They migrate southwestwards to India and East Africa, and are in Kenya from about November to April. This one, on 14 April 2019, would have been close to departure time. This photo, and two more, are curated at http://vmus.adu.org.za/?vm=BirdPix-75885.
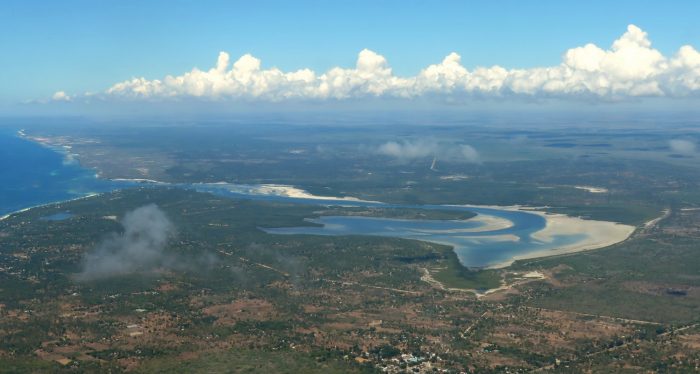
Provided the winds and the clouds collaborate, flights in and out of Malindi provide a great view of Mida Creek. It is an inlet to the sea, and tidal, but there is no river running into it.
Mida Creek has an area of about 3,200 ha, a combination of tidal sandflats and mangrove forests.
Mida Creek is both a stopover site for migratory waders on passage northward (with an April peak) or southward (with a September-October peak) and a migratory destination in its own right (with birds staying from September to April). It is one of the most important sites for waders along the western rim of the Indian Ocean. To the north, the next really important stopover site is Barr al Hickman in Oman, about 4,000 km away.
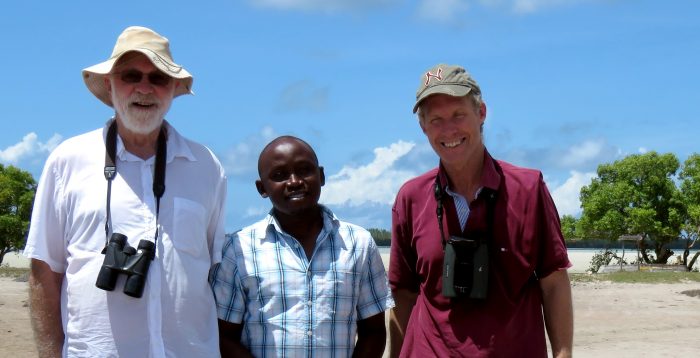
Juma Badi stands between Colin and me. He is a Community Guide. While Colin was in Cape Town finishing his PhD, Juma diligently collected one of the best data sets of its type in Africa. Every five days, for two years, he counted the waders along a 1 km transect across Mida Creek. This provided fantastic information on the timing of arrival and departure of waders.
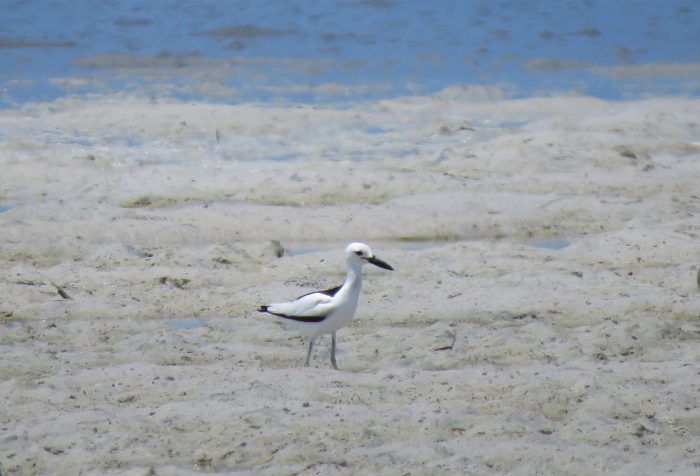
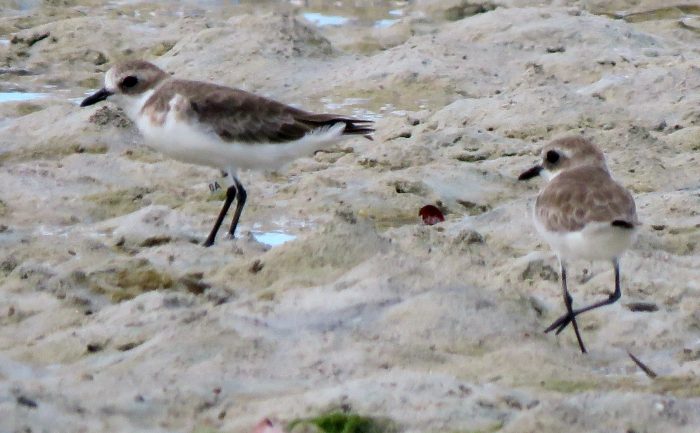
I saw my first Crab Plover at Mida Creek. Not just one, but hundreds. Mida Creek is a key non-breeding site. Curated at http://vmus.adu.org.za/?vm=BirdPix-75478.
Here is a Lesser Sand Plover. It has a leg-flag and is one of Colin’s study birds. It is curated at http://vmus.adu.org.za/?vm=BirdPix-75479. Colin’s PhD considered the migration and moult of three species along the Indian Ocean “rim”: Greater and Lesser Sandplovers and the Terek Sandpiper at localities in Kenya, India and Australia. In comparison with wader species which migrate along the coastlines of the Atlantic Ocean and Pacific Ocean, these species are poorly researched, and Colin’s thesis helps fill an important gap in knowledge.
Colin also placed leg flags on Greater Sand Plovers. On 16 September 2013 he added a ring flag to a bird he had first ringed at Mida Creek nine years earlier. It was resighted on the shore in Kutch, India, on 10 April 2015. It was resighted the following year on the same beach in India, on 29 March 2016. Great Sand Plovers breed in Kazakhstan and western Mongolia. The full story is here!
Colin was surprised to see a House Crow deep into Mida Creek, and quite far from any human habitation. It was at the interface between the mangroves and the mudflats. This invasive alien started its African career at Mombasa. It is now so pervasive that there is no chance of eradicating it. This record is curated at http://vmus.adu.org.za/?vm=BirdPix-75411.
An early start at 5:45 a.m. enabled us to reach Matjiesfontein railway station just after first light. We were traveling from Cape Town to Hanover in the Northern Cape, a journey which would typically require seven hours transit time. Instead, we used nearly twelve!
Though our final destination was Karoo Gariep Nature Reserve, the journey itself provided a chance to contribute to the Virtual Museum, and in particular, BirdPix.
Road trips are golden opportunities to fill “holes” in Virtual Museum datasets; many grid cells along the national roads have either very few records or none at all. Currently, BirdPix data are being used to generate species distribution maps which will be compared to SABAP2 maps. If BirdPix-generated maps are able to closely replicate the SABAP2 distributions, we may be able to apply the same methods to other VM datasets, modelling the distributions of butterflies, dragonflies, reptiles, and more!
With this in mind, we decided to use our trip to improve the existing coverage of the BirdPix dataset. By planning ahead, we identified a few sparsely populated cells to target along the journey, the first of which was Matjiesfontein.
Matjiesfontein falls in quarter degree grid cell 3320BA, which previously contained only two records: Speckled Pigeon and Fiscal Flycatcher, both reported by Zenobia van Dyk in 2018. Following a brief twenty-minute exploration of the area, however, we added 28 records to the list! These include species such as Blacksmith Lapwing, Cape Weaver, Common Starling, Laughing Dove, and this White-backed Mousebird, one of several encountered.
Our next target was Leeu-Gamka, another small railway station approximately 350km northeast of Cape Town. This grid cell contained no records. We stopped near fields and buildings, searching for ibises among irrigation systems and doves along rooftops, and were well-rewarded for our efforts. In under an hour, Leeu-Gamka’s grid cell was brought from 0-18 species! One of my favourite finds was a Pririt Batis, hunting for insects just outside a supermarket.
In addition to their important place in data collection, long-distance road trips also allow for interesting observations on species ranges. For instance, in Matjiesfontein, we encountered Cape Bulbuls, but in Leeu-Gamka, just 150km northeast, were greeted by these African Red-eyed Bulbuls.
The distributions of both species are closely linked with the landscape: Cape Bulbul occurs in fynbos and coastal scrub vegetation, whilst the African Red-eyed Bulbul is commonly found in arid savanna and riparian bush.
We stopped at a few other locations along the road to Hanover, including an abandoned cluster of buildings near Nelspoort in the Nuweveld Mountain Range. The disused structures are now colonised by a variety of avian species, including Red-headed Finch, House Sparrow, Cape Sparrow, Southern Grey-Headed Sparrow, and Familiar Chat.
The “prize” finding of the day, though, came much closer to our destination, and was easily my favourite: a pair of secretary birds just outside of Hanover.
These beautiful birds typically avoid busy areas, so spotting these two just off the national road was a surprising treat.
At the end of the day, 59 records were added across 5 grid cells! Contributions like these show the sizeable impact that a few extra stops can have in unpopulated or remote regions. Paired with some cautious driving, roadsides become fantastic spots for birding and generating citizen science data.
The scope is by no means limited to birds–you can contribute on your next journey via any of the Virtual Museum’s collections, and share the species you encounter along the way!
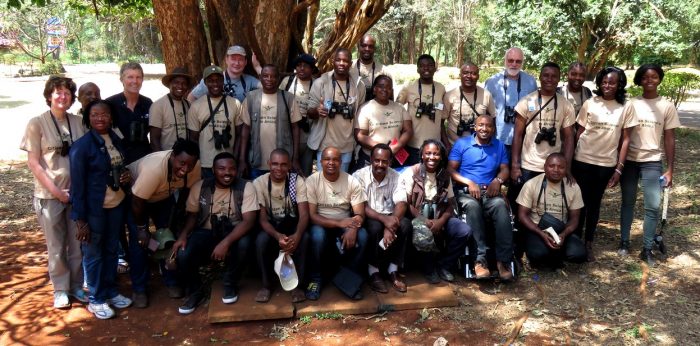
It was a great privilege to be part of the team teaching at a course for the Tropical Biology Association in Nairobi during April. The course was called “Analysing and interpreting citizen science data.”The Tropical Biology Association (TBA) is making a fantastic contribution to capacity building for biodiversity conservation in Africa and southeastern Asia. The impact of the TBA is awesome, and browsing its website is an inspiration. It punches way above its size. The TBA has helped launch the careers of more than 2,000 conservation champions. My Nigerian PhD students have talked to me enthusiastically about the TBA courses they participated in. For example, Dr Zingfa Wala, who did a four-week TBA course in Madagascar, says: “The TBA course is the one that had the most impact in my career. It exposed me to practical and hands-on experimental design. It was my first experience working with a team and it opened up great networking opportunities.”
An indication that the TBA had identified a genuine need is the fact that more than 200 people applied, 10 times more than could be accommodated. The 22 participants who were selected came from 10 African countries: Liberia, Benin, Nigeria, Cameroon, Congo, Uganda, Kenya, Rwanda, Tanzania and Botswana. We gathered at the National Museums of Kenya on Monday 8 April for a week-long course that started at 8 am each morning and finished at 5 pm.
Two sets of numbers from 1 to 11 were placed on the tables, and each participant had to find the other person with the same number, and introduce that person. Clara Cassell from Liberia got paired with Judith Mirembe from Uganda. Judith told us that Clara does yoga, and Clara told us that Judith plays hockey. Judith is also leader of Uganda Woman Birders and was recently featured by the Audubon Society: https://www.audubon.org/news/when-women-run-bird-world.
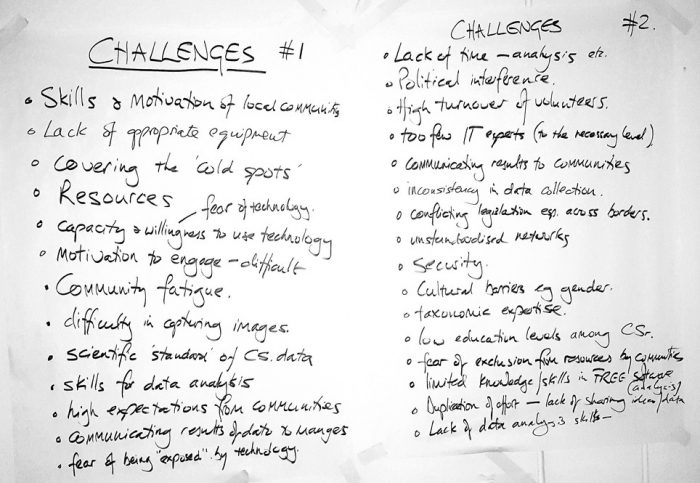
The main thrust of the course was the analysis of the data collected through citizen science projects. Dr Rosie Trevelyan, who heads up the TBA, facilitated many discussions. This is the output from a session in which we discussed the challenges of doing citizen science in Africa.
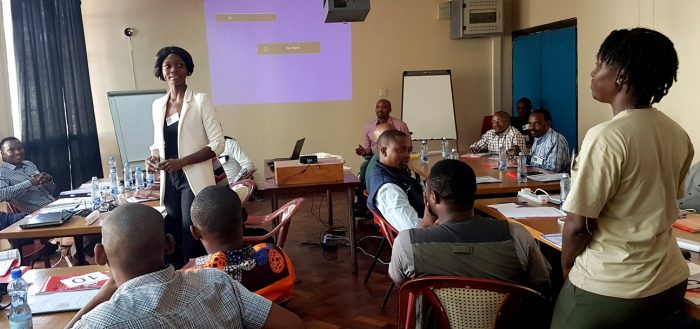
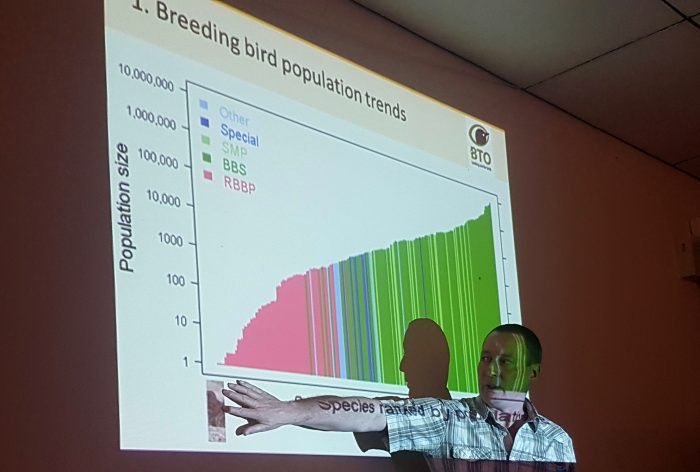
The participants were taken step-by-step through the basics of R, developing the skills needed to produce maps of their own countries in R. This part of the course was led by Dr Simon Gillings, of the British Trust for Ornithology. Here he is describing some of the outputs from the citizen science projects he is responsible for, dealing with birds in the UK.
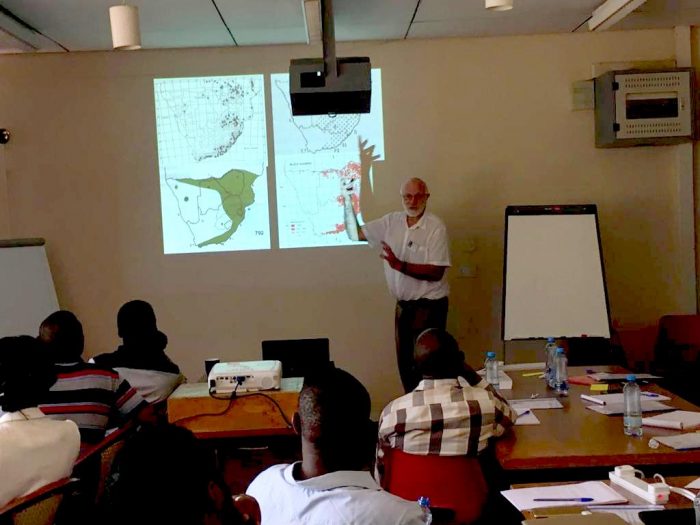
My own contribution to the week consisted of six presentations. This slide illustrates how ideas about the distribution of the Amethyst Sunbird chopped and changed. The truth emerged in 1997 as a result of the distribution map generated by citizen scientists in the first bird atlas. This is the map in the bottom right hand corner of the slide.
There were visiting lecturers. One was David Clarence, who is professionally an econometrician, and an enthusiastic contributor to the bird atlas project in Kenya. He has applied his statistical skills to the Kenyan bird atlas data, and he described to us the huge strides he has made in the analysis.
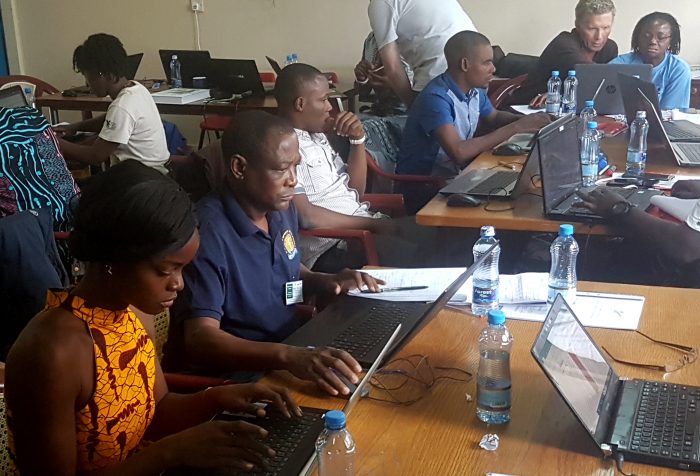
During the course, there was lots of time allocated to working on the datasets the participants had brought with them. This enabled them to get help when stuck.
We spent one morning in the Nairobi City Park. In part it was a great excuse to get outside and in the sun, but more importantly it was an opportunity to test protocols for collecting data. City Park is an excellent resource for this kind of activity. This Blotched Leopard Lachnoptera ayresii was the first record for the species in LepiMAP, the Atlas of African Lepidoptera, for the grid cell (0136BD) into which Nairobi falls (see http://vmus.adu.org.za/?vm=LepiMAP-678745). Here is the map of the Nairobi grid cell (City Park is in the north-centre of the grid cell) and list of species for the Nairobi grid cell http://vmus.adu.org.za/vm_locus_map.php?vm=lepimap&locus=0136BD. Currently that list has 68 species.
Quite a large part of the museum precinct is natural vegetation. After the classes one day a group of participants found this horned chameleon. It got submitted to ReptileMAP (http://vmus.adu.org.za/?vm=ReptileMAP-170398) and was identified as Jackson’s Chameleon Trioceros jacksoni. One of the participants on the course was Laban Njoroge, who is the entomologist at the museum. The museum’s collection of insects was on the same floor as our course venue, so Laban had the shortest distance between his office and the course! In the course WhatsApp group, Laban told us about the Jackson whose name is attached to this chameleon: “This man Jackson was a seasoned and passionate naturalist. In one of the AGMs of the then East African Natural History Society (now Nature Kenya, Nature Uganda and Nature Tanzania) he came up with an idea of making natural history collections. To kick start his idea he donated a drawer of butterflies. This is how the huge insect collection at National Museums of Kenya was started. This drawer still remains in our collection to date.”
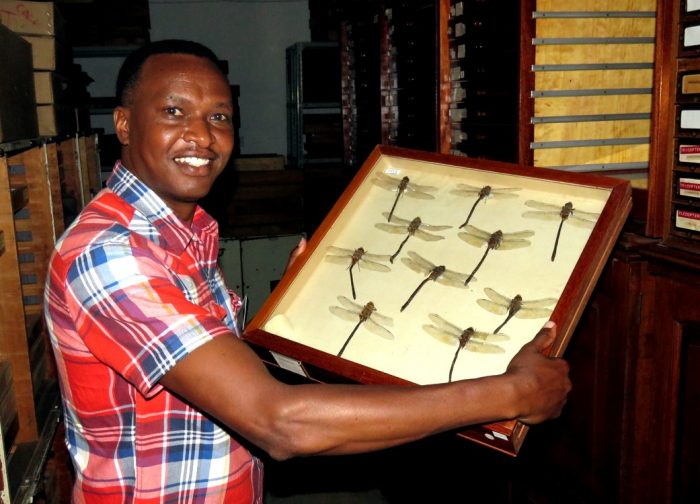
Laban took me on a tour of the insect collection he curates. Since Jackson’s time, the National Museums of Kenya’s collection has grown to more than three million specimens. Here is Laban showing me the Black Emperors Anax tristis in the collection. This is Africa’s largest dragonfly, with a wingspan of about 13 cm. This is also one of Africa’s largest and most valuable insect collections.
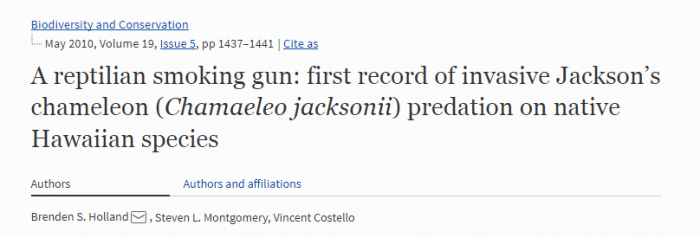
Back to Jackson’s Chameleon! It is astonishing that an animal like a chameleon can become a problematic invasive alien when introduced elsewhere. Chameleons form part of the pet trade, and some Jackson’s Chameleons were released in Hawaii. Here is part of the abstract of the paper in the journal Biodiversity and Conservation featured above: “Native Hawaiian invertebrates, including four individuals of an endangered species, were discovered in the dissected stomachs of wild caught Jackson’s Chameleons collected from June to November 2009 on the island of Oahu, Hawaii. Jackson’s Chameleons were introduced to the Hawaiian Islands in the early 1970s. Of particular concern is the fact that introduced chameleons have previously only rarely been found in native Hawaiian habitat. One concern is that Jacksons’s Chameleons may be undergoing a range expansion into upper elevation pristine forests. If they reach and establish populations in these areas, devastating impacts to the native ecosystem are possible.”
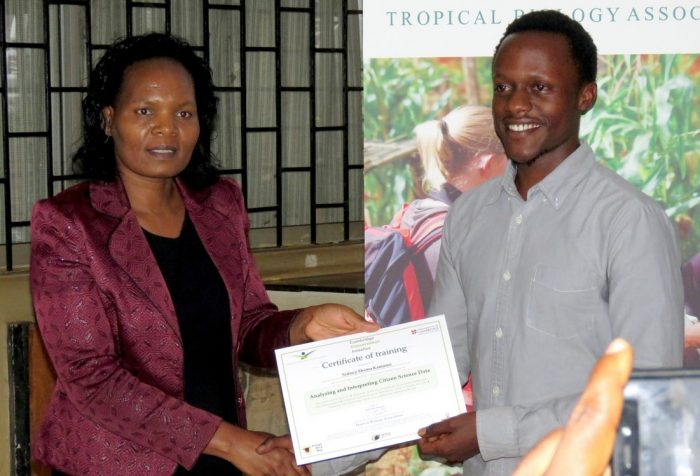
At the end of the course, each participant received a certificate. Here, Sidney Shema, who leads the bird atlas project in Kenya, is presented with his certificate by Professor Mary Gikungu, who is the Director of National Repositories and Research at our host institution, the National Museums of Kenya. Professor Gikungu is a entomologist specialising in bees.
Thank you to Rosie Trevelyan and Anthony Kuria (TBA) for the invitation to participate. It was a rich and rewarding experience. We hope that the BDI and the TBA can find ways to collaborate in the future.
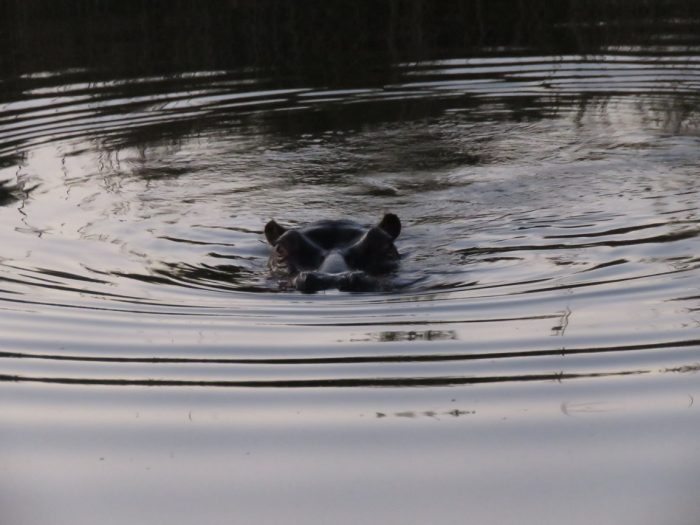
Within an hour of a dusk arrival at what was then known as the Karoo Gariep Nature Reserve (now the Khoisan Karoo Conservancy) …
… we had not only been shown the “hippo pool”, we had seen a hippopotamus …
The Seekoei River flows through PC Ferreira’s farm, New Holme, between Hanover and Colesberg in the Northern Cape, South Africa. PC investigated why the river was called the Seekoei (Hippo) River. He found that the last hippos along the Seekoei River had been on his farm, where they had been hunted to extinction in the late 1700s, probably 1778. PC worked for many years to get permission to do a re-introduction, and finally got it right to re-introduce a small group of hippos in 2006. For PC, this was the launch of a passion for conservation, and has transformed the traditional sheep farm of New Holme into a space where biodiversity takes precedence. It has official “nature reserve” status. PC is working with farmers all along the Seekoei River to establish a vast corridor of protected area.
The Karoo Gariep Nature Reserve at the farm New Holme is a locality where the Biodiversity and Development Institute will establish research projects for international and local students. The detailed planning for this is in progress, and we hope to have our first students busy on their projects early in 2020. This trip was part of the planning process. There are massive opportunities for fascinating projects here. Even though New Holme is almost exactly half way between Cape Town and Johannesburg, our accommodation is only 8 km from the N1, and there is a good bus service along this route between the two cities. The bus stops at Hanover, 25 km away.
Besides the business, we had fun …
PC and his family are magnificent hosts. One evening we were treated to a braai at the dam. Here, PC and one of his daughters, Iané, are baking bread over the coals. The dam is a waterbird paradise, and presents its own set of research opportunities.
Even though New Holme is a nature reserve, it is a working farm; PC has greatly reduced stocking rates of sheep below what is the norm for a Karoo farm. Behind the sheep are White-breasted Cormorants, Grey Heron and African Spoonbills. All these species were BirdPixed.
Rick Nuttall, from Bloemfontein, was also visiting New Holme for the weekend. Rick is a serious contributor to the Virtual Museum. And …
… here is the Black-winged Stilt he was stalking! Rick has uploaded this photograph to the BirdPix section of the Virtual Museum; it is curated for posterity at http://vmus.adu.org.za/?vm=BirdPix-79791. The number of species with photographic records in BirdPix for the quarter degree grid cell 3024DC is currently 82. Almost all of these records were made at the Karoo Gariep Nature Reserve. You can see the list by going to http://vmus.adu.org.za/vm_locus_map.php?vm=birdpix&locus=3024DC. On the right hand edge of the table containing the list of species, you can click on “records” and see the photographs which support the inclusion of the species on the list.
The karoo comes to life at night. An after-dinner drive into the veld with PC is an unforgettable experience. He has developed the concept of the “shy five” to rival the “big five”. And even though the Karoo is an arid region, the diversity of nocturnal animals can be astounding. Possible sightings include aardwolf, Cape fox, bat-eared fox, African wildcat, aardvark, porcupine, striped polecat, African striped weasel, and both small and large spotted genets. Really lucky visitors see the tiny and rare black-footed cat.
And here is Rod Green’s record of aardvark! (curated in MammalMAP at http://vmus.adu.org.za/?vm=MammalMAP-28072). Rod, photographer from Port Elizabeth, was also visiting for the weekend. He achieved this result under difficult circumstances!
In a nutshell, the Khoisan Karoo Conservancy is a remarkable place, and highly recommended. The BDI team looks forward to working closely with PC. Through this interaction we hope to provide research training and opportunities for both international and local students. We hope also to make a substantive contribution to biodiversity conservation in the Karoo.
Dark-backed Weavers are locally common in forest patches along the eastern seaboard of Africa and across Eastern and central Africa to Cameroon. Their nests may be obvious, hanging above forest paths. Nests of this species are invariably sited singly in trees, although occasionally an old nest or two from previous breeding seasons may be near the current nest. Nests usually have a long entrance tunnel. Nests of the Dark-backed Weaver may be viewed at a citizen science project, PHOWN (PHOtos of Weaver Nests).
Dark-backed Weaver at Nest
Less than 400 Dark-backed Weavers, however, have been ringed in South Africa, the lowest species total for any South African weaver species. This is partly due to the fact that they often forage high in the canopy, where it is difficult to place mist-nets, although they do descend to lower levels as well. They also usually occur in pairs, not in flocks as many of the gregarious weavers, although the Dark-backed Weaver may join foraging mixed-species flocks of insectivorous birds.
The oldest Dark-backed Weaver in the SAFRING database is 5 years 2 months (ring BH34002), but the longevity will be considerably more than this – most weavers have known longevities over 10 years.
Dark-backed Weavers show some plumage variation across their range in Africa – these variations are briefly listed under the different subspecies notes, together with a map of subspecies distributions, at the Weaver Watch species page. Biometrics also vary slightly across its range, but not in any obvious pattern.
Dark-backed Weaver adult
Dark-backed Weaver males and females are alike. Juveniles are similar to adults, but there are some features that help separate juveniles (photo below) from adults (photo above). Juveniles have:
• pale gape flanges
• a paler bill (with a yellow tinge in above above, compared to bluish-grey in adult)
• mottled or pale throat
• darker brown eye
On Sunday morning, 5 May 2019, the grid cell “Yzerfontein” had 15 BirdPix* records for 12 species. This called for an intervention! So I went BirdPixing in Yzerfontein. This took the form of a morning’s expedition. (* BirdPix is a citizen science project building a photographic bird atlas of Africa, and the data will supplement that of the Second Southern African Bird Atlas Project (SABAP2).)
Here are the thumbnails of these 15 records arranged as a collage! Most of them are from Dassen Island, which falls within this grid cell. So there was lots of scope to add species from the mainland!
To a 72-year old arriving in Yzerfontein in 2019, the most striking thing about the place is how much it has grown. The map on the left is the 1:50,000 map which we used when the Western Cape Wader Study Group did the surveys of wader populations along the coastline in the 1970s. The pencil lines mark the count sections used in the surveys. The village, then officially called Ysterfontein, is tiny. The longest length of the village is shorter than the length of the name on the map. The 2019 Google satellite image shows the massive expansion of the built-up area. It’s now a small town, with supermarkets. A shopping mall is on the way!
It’s not hard to understand the attraction. The view south towards Table Mountain is pretty stunning.
For some bird species, the development provides new opportunities. For example, …
… palm trees in the gardens provide breeding opportunities for Cape Weavers. With the natural coastal vegetation, there would be no weavers here. This colony is curated in PHOWN (PHOtos of Weaver Nests) at http://vmus.adu.org.za/?vm=PHOWN-28432.
At some stage in the future, this Grey-backed Cisticola (http://vmus.adu.org.za/?vm=BirdPix-77410) will lose its home to the development staked out by this steel peg.
But the town layout contains a fair amount of open space. This will preserve corridors of natural habitat, and many species of birds will persist in them.
In a coastal town in the Western Cape, such as Yzerfontein, there is often a gathering place for Hartlaub’s Gulls (http://vmus.adu.org.za/?vm=BirdPix-77382). In Yzerfontein, the roof of NSRI Station 34 was the scene of action. It is worth searching through a flock like this for Grey-headed Gulls. A vaguely grey hood – there are at least two in the photo above – is not enough. Grey-headed Gulls have distinctly whitish eyes and the eyes of Hartlaub’s Gulls are dark brown, almost black. The careful scrutiny of the gulls revealed …
… a pink-headed Gull! This bird has a whitish eye (so a Grey-headed Gull), but has a pinkish wash in the places where it ought to have grey! So this photo (and two more) have been uploaded to the BOP section of the Virtual Museum (BOP = Birds with Odd Plumage) where they are curated in perpetuity (see http://vmus.adu.org.za/?vm=BOP-552). There has been a bit of an outbreak of pink in BOP, especially among the Cattle Egrets (for example, and most spectacularly, at http://vmus.adu.org.za/?vm=BOP-523, and look at this Hartlaub’s Gull http://vmus.adu.org.za/?vm=BOP-524).
Yzerfontein, superficially, is a peaceful coastal town. But dressed in black, and openly displaying their red dagger-shaped weapons, here are the Yzerfontein hooligans. This is just part of the flock of frustrated bachelors and spinsters; there were about 30 in total. These are adolescent and young adult African Oystercatchers (http://vmus.adu.org.za/?vm=BirdPix-77391). Their sole objective in life is to disrupt the lives of established breeding pairs along the coastline. The establishment of these flocks is evidence of an “over-production” of oystercatchers in recent decades. This, in turn, is a consequence of the invasion of their range of the Mediterranean mussel Mytilus galloprovincialis which grows faster and higher up the intertidal than the indigenous mussel which it has replaced. It is not much fun being an adult oystercatcher on the coastline these days. Either you are frustrated because you don’t have a mate or a territory. Or you spend your life keeping an eye on your mate, and warding off attacks by the hooligans.
I was alert to opportunities to contribute to other sections of the Virtual Museum. A lizard basking in the sun, or a snake squashed on the road, is a ReptileMAP opportunity. The dragonflies in the stream that passes under the road can be OdonataMAPped. A family of dassies sunning themselves on the rocks can go into MammalMAP. Butterflies are usually a big challenge; but this Common Dotted Border was very co-operative. The photo is not all it could be, but it is good enough for a positive identification (curated at http://vmus.adu.org.za/?vm=LepiMAP-682293).
At the end of a morning full of fun and interest, the number of BirdPix records increased from 15 to 67, and the number of species from 12 to 39. I created quite a few duplicates by including records of the same species both for the agricultural sector of the grid cell, and for the built-up area. The collage of thumbnails for the quarter degree grid cell 3318AC Yzerfontein has improved from the one at the top of this blog to the one below, at the end! BirdPixing in Yzerfontein proved pretty rewarding.
You can get the map of the grid cell and the full list list of the BirdPix species (possibly updated) by going to http://vmus.adu.org.za/vm_locus_map.php?vm=birdpix&locus=3318AC. You can create the collage below by clicking on “Records for 3318AC” and then clicking on “Display thumbnails only”.
Mansell M, Underhill LG, and Navarro R. 2019. LacewingMAP – Progress report on the Atlas of African Neuroptera and Megaloptera, 2014 – 2019. Biodiversity Observations 10.10:1-21
LacewingMAP – Progress report on the Atlas of African Neuroptera and Megaloptera, 2014 – 2019
Mervyn Mansell
Department of Zoology and Entomology, University of Pretoria, Pretoria, 0002 South Africa
Les G Underhill
Animal Demography Unit, Department of Biological Sciences, University of Cape Town, Rondebosch, 7701 South Africa; Biodiversity and Development Institute, 25 Old Farm Road, Rondebosch, 7700 South Africa
Rene Navarro
Animal Demography Unit, Department of Biological Sciences, University of Cape Town, Rondebosch, 7701 South Africa; FitzPatrick Institute of African Ornithology, Department of Biological Sciences, University of Cape Town, Rondebosch, 7701 South Africa
Abstract
This report describes progress with the atlas of lacewings, defined as the orders Neuroptera and Megaloptera, up to 31 March 2019. The database of the project contained 15,781 records, in two components – 12,898 specimen records and 2,883 photographic records – submitted to the LacewingMAP section of the Virtual Museum, over a period of 4.5 years (September 2014 to March 2019). The average rate of submission of photographic records for LacewingMAP for the four calendar years 2015 to 2018 was 566 per year, three times faster than the rate at which the specimen database grew during the second half of the 20th century. 234 citizen scientists contributed photographic records to LacewingMAP. It seems that almost all of these people have primary interests in other taxa, and that the records submitted to LacewingMAP were a ‘by-catch’. Photographs of at least two new species were submitted by citizen scientists during 2018.
What are the lacewings, and why are they interesting?
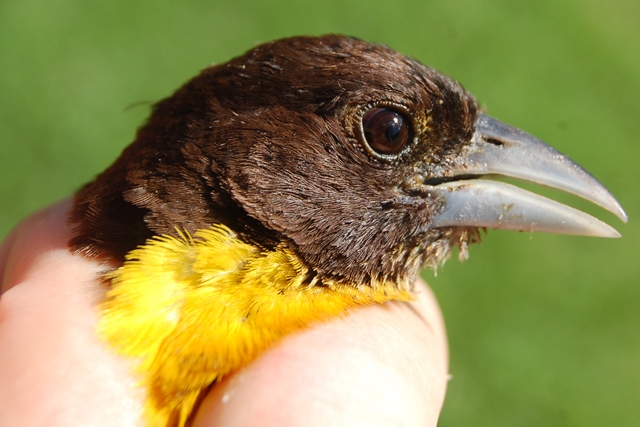
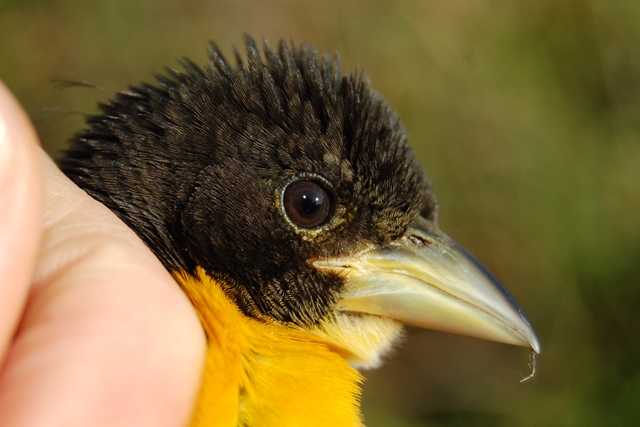
We live in a world which is lacewing-blind. Most people would not be able to identify a flying insect as a lacewing, let alone distinguish between species (Figures 1 and 2). But almost everyone has encountered an artefact created by the larvae of lacewings. They recognize the distinctive funnel-shaped pits in sandy areas (Figure 3), and they have been told that there is a beast called an antlion lying in wait below to consume any insect that slips down the side of the funnel. But, few people grasp that the antlion is to the lacewing what the caterpillar is to the butterfly. They are blind to the existence, and value, of lacewings, the adults of the creatures that live in the sand.
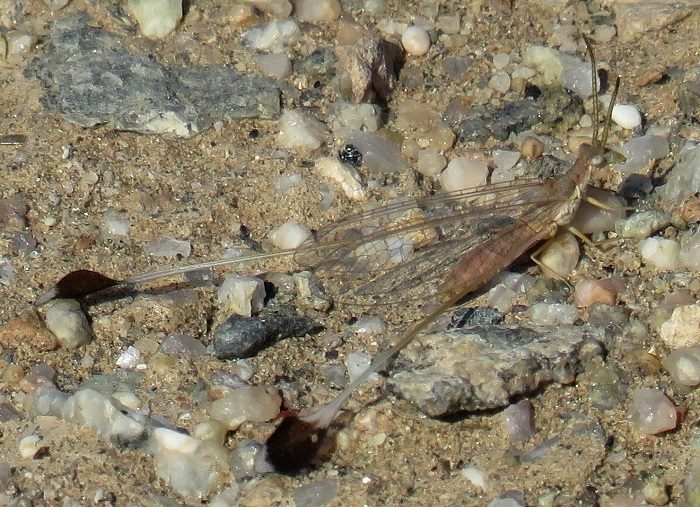
Fig 1. With 518 records, Myrmeleon obscurus is the most frequently recorded species in the LacewingMAP database. There are 124 photographic records. This photograph was taken by Alan Manson in Pietermaritzburg, KwaZulu-Natal. This record is curated at http://vmus.adu.org.za/?vm=LacewingMAP-9551
Fig 2. With 516 records, Hagenomyia tristis is the second most frequently recorded species in the LacewingMAP database. There are 154 photographic records. This photograph was taken by Bernardine Altenroxel near Mooketsi, Limpopo. This record is curated at http://vmus.adu.org.za/?vm=LacewingMAP-596
Fig 3. The conical pit-trap constructed in sand or loose soil by larvae of some antlions. The larvae buries itself at the bottom. Ants and other small arthropods fall over the edge, slip to the bottom of the pit-trap and are unable to climb out because of the steepness of the slope and the looseness of the sand. They are pounced on by the ant-lion larva, which then sucks the body fluids out of its prey. The dry husk is tossed out of the pit, which is then repaired.
13 of the 16 recognised families of Neuroptera occur in southern Africa, and both families of Megaloptera. This report focuses mainly on the Neuroptera, popularly known as lacewings. The Afrotropics (i.e. Africa south of the Sahara Desert) has an especially rich and varied fauna of lacewings and approximately 500 species occur in southern Africa alone, defined as the region south of the Kunene and Zambezi Rivers (Mansell 2002). Furthermore, about half of these are endemic to this area.
Neuroptera are excellent indicators of environmental and habitat transformation, and include key species for signifying areas and faunas that require priority protection. They are vulnerable to habitat fragmentation and pesticide contamination (Mansell 2002, Winterton et al. 2010).
The larvae of the lacewings are all specialised predators with unique, highly evolved mouthparts. As predators, lacewing larvae have the potential to have a major impact upon populations of other insects and small Arthropoda, and especially aphids. They have therefore, long been considered an attractive option as biological control agents in greenhouses, orchards and fields (New 1975, Mansell 2002). The recommendation is to augment species native to an area by means of mass rearing, and not to introduce new lacewing species (New 1985).
Only one of the families, the Myrmeleontidae, includes species whose larval stage consists of antlions that construct funnel-shaped pits in sand (Figure 3). The larvae of the other families take on a diverse variety of forms; they range from aquatic to semi-aquatic, and there are species with larvae which live freely in sand, under rock ledges, small caves, holes in trees, and as free-living ambush predators on vegetation. Some are parasites in spider nests, and inquilines in ant nests. Nothing is known about the larvae of some species (Mansell 2002, Winterton et al. 2010).
The Neuroptera are model subjects for scientific research because they have a wide diversity of lifestyles. Adults of several families are key pollinators of indigenous flora; especially the family Nemopteridae (the thread-wing and the spoon-and ribbon-wing lacewings) (Mansell 2002).
What is the objective of LacewingMAP?
Given that the lacewings are important, the long-term objective of the LacewingMAP project is to develop an atlas of the distributions of the Neuroptera and Megaloptera in Africa, focusing initially on southern Africa, then the Afrotropics, and ultimately the African continent. The project is loosely modelled on the “butterfly atlas” and the “reptile atlas” (Mecenero et al. 2013, Bates et al.2014). For both those projects, the foundational data were the historical specimen record data, supplemented by photographic data uploaded to the “Virtual Museum” by citizen scientists. The Virtual Museum is described by Mecenero et al. (2013) and Bates et al. (2014). The lacewing atlas uses the same strategy. Specimen records were (and continue to be) assembled by us, photographic records are collected by citizen scientists, and the combined database is curated by the Virtual Museum.
This report reviews progress up to March 2019. The first image of a lacewing was uploaded to the LacewingMAP section of the Virtual Museum on 19 September 2014. This report is based on the specimen database, plus photographic records assembled over four and a half years, up to 31 March 2018.
What is the volume of records in the LacewingMAP database?
The total number of records in the LacewingMAP database on 31 March 2019 was 15,781 (Table 1). They are split into two components in this database, seamlessly merged as a single entity. The largest component consists of 12,898 records, mainly based on museum specimens, assembled by us, and recorded in a Palpares Relational Database (Mansell & Kenyon 2002). This is supplemented by 2,883 photographic records, submitted to the LacewingMAP section of the Virtual Museum (http://vmus.adu.org.za) by citizen scientists (Table 1). Each photographic record uploaded to the Virtual Museum contains either one, two or three images of the live animal; each record is evaluated by us, and we allocate it to family, genus or species.
Table 1. Numbers of LacewingMAP records for African countries on 31 March 2019. The second column gives the number of photographic records uploaded by citizen scientists; the third total gives the total number of records in the database for each country.
Country
LacewingMAP
Total
Algeria
1
Angola
5
38
Benin
11
Botswana
100
391
Burkina-Faso
26
Burundi
2
Cameroon
33
Cape Verde Islands
11
Central African Republic
8
Chad
8
Comoros
13
Democratic Republic of Congo
3
708
Djibouti
8
Equatorial Guinea
20
Eritrea
6
Ethiopia
15
Gabon
25
Gambia
17
Ghana
1
20
Guinea
19
Ivory Coast
36
Kenya
23
205
Lesotho
1
10
Liberia
1
3
Madagascar
4
115
Malawi
170
342
Mali
49
Mauritania
10
Mauritius
3
Mozambique
43
144
Namibia
90
1,020
Niger
24
Nigeria
11
54
Reunion
4
Rwanda
3
Senegal
51
Seychelles
14
Sierra Leone
1
5
Socotra Island (Yemen)
4
Somalia
1
24
South Africa
2,225
10,917
St Helena
2
Sudan
8
20
Swaziland
87
197
Tanzania
13
119
Togo
11
Uganda
21
Zaire
4
Zambia
87
346
Zimbabwe
9
644
Total
2,883
15,781
The majority of the 2,883 photographic records, uploaded to the Virtual Museum were submitted from South Africa (2,225, 77%) (Table 1). A total of 658 records were submitted from 20 other African countries; six countries had more than 40 records: Malawi (170), Botswana (100), Namibia (90), Swaziland (87), Zambia (87) and Mozambique (43) (Table 1).
In the overall database, 10,917 records are from South Africa (Table 1). Countries with totals more than 500 records are Namibia (1,020), Democratic Republic of Congo (708) and Zimbabwe (644) (Table 1). 50% of Malawi’s 342 records are photographic, as are 44% of Swaziland’s 197 records, and 30% of Mozambique’s 144 (Table 1).
Within the nine provinces of South Africa, the largest contributions of photographic records have come from Northern Cape (484, 21.7% of total of 2,222 for South Africa), Limpopo (456, 20.5%) and KwaZulu-Natal (420, 18.5%) (Table 2). Within the database as a whole, Limpopo has the most records (2,606, 24.6% of 10,594 records for South Africa) and the Northern Cape has 1,688 (15.9%) (Table 2). Three of the photographic records and 323 of the total records from South Africa did not have “province” assigned (Tables 1 and 2).
Table 2. Numbers of LacewingMAP records for the provinces of South Africa on 31 March 2019. The second column gives the number of photographic records uploaded by citizen scientists; the third total gives the total number of records in the database for each province.
Province
LacewingMAP
Total
Eastern Cape
180
867
Free State
65
225
Gauteng
171
918
KwaZulu-Natal
420
1,390
Limpopo
456
2,606
Mpumalanga
161
1,110
North-West
38
622
Northern Cape
484
1,688
Western Cape
249
1,168
Total
2,222
10,594
The average rate of submission of photographic records for LacewingMAP for the four years 2015 to 2018 was 566 per year (Table 3). This rate can be compared with the annual collection rate for the specimen section of the database (Table 4). The photographic rate generated by citizen scientists is 64% above the “best” decade (the 1980s), 5.5 times more than the 20th century as a whole (102 per year), and three times more than the second half of the 20th century (176 per year) (Table 4).
Table 3. Annual totals (1 January to 31 December of each calendar year) of photographic submissions to the LacewingMAP section of the Virtual Museum. The row Pre-start refers to records of lacewings submitted to OdonataMAP. These were not deleted from the Virtual Museum database, and were re-allocated to LacewingMAP when the project started (see Figure 2). The total for 2019 is incomplete.
Year (Jan to Dec)
Number of submissions
Pre-start
21
Sep to Dec 2014
299
2015
547
2016
502
2017
536
2018
678
Jan to Mar 2019
300
Total (31 Mar 2019)
2883
Table 4. Using the specimen database, the average number of records per year was calculated for each decade of the 20th century, and the 21st century to date.
Decade
Records per year
1900-09
10.8
1910-19
29.1
1920-29
36.0
1930-39
48.6
1940-49
20.4
1950-59
63.3
1960-69
75.0
1970-79
151.3
1980-89
345.5
1990-99
244.1
2000-09
136.9
2010-18
61.3
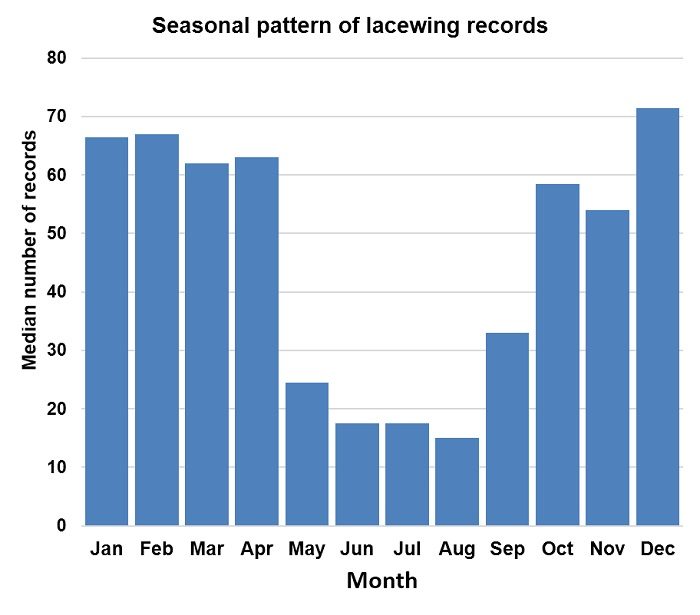
The monthly pattern of submissions shows a minimum in the winter months from May to August, and a peak in the summer months from December to April (Figure 4). This plot confirms the general pattern of seasonality of conspicuous occurrence of lacewings.
Fig 4. The histogram shows the seasonal pattern of the submission of photographic records to the LacewingMAP section of the Virtual Museum. The height of the bar for each month is the medians of the number of records submitted in that month over the four years 2015 to 2018.
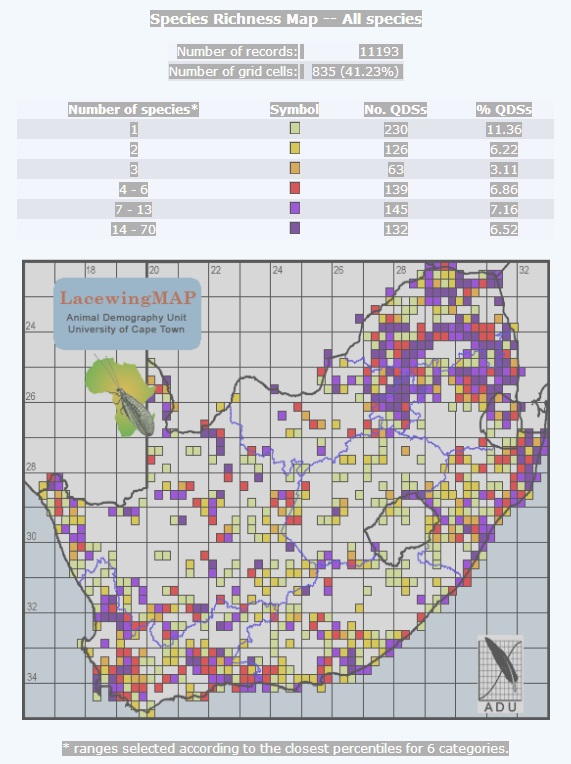
Each record is georeferenced as accurately as feasible. For mapping purposes each record is allocated to a quarter degree grid cell. This 15-minute grid system has been widely used by biodiversity atlas projects in southern Africa (e.g. Mecenero et al. 2013, Bates et al. 2014). The 15-minute (quarter degree) grid generates 2025 quarter degree grid cells in South Africa, Lesotho and Swaziland. Of these, 835 grid cells (41.2%) have at least one species of lacewing recorded (Figure 5). 230 grid cells have a single species recorded in them. On the other hand, there are only two degree cells with no records at all, one in the Northern Cape and one in North West Province. At this stage, the patterns of species richness still reflect observer effort rather than the true distribution of species richness.
Fig 5. LacewingMAP species richness in South Africa, Lesotho and Swaziland per quarter degree grid cell, on 31 March 2019. The species richness is grouped into six classes, with the cutpoints chosen so that, as close as possible with integer arithmetic, 1/6th of the grid cells have the same colour. There is at least one species recorded in 835 of the 2,025 grid cells in the three countries (41.2%).
What species are in the LacewingMAP database?
The taxonomy upon which LacewingMAP is based contained 1,249 species in March 2019 (Table 5); this taxonomic spine, which is pivotal for the project, is updated from time to time, as necessary. This taxonomy is of Afrotropical species; 18 of these species are from the order Megaloptera (two families Corydalidae and Sialidae), and the remaining 1,231 species are Neuroptera, classified into 13 families (Table 5). By far, the largest family is the Myrmeleontidae, containing 461 species. 415 species of Neuroptera are currently known from South Africa (Mansell & Oswald 2018), and 834 from the remainder of the Afrotropical Region, i.e. species that do not occur in South Africa.
Table 5. The column headed ‘Sp. in tax.’ (Species in taxonomy) provides the number of species in each of the 15 families in the two orders (Megaloptera and Neuroptera). This is based on the taxonomy in use in LacewingMAP in March 2019. This taxonomic ‘spine’ is updated at intervals. The remaining columns provide the number of photographic records for each Family which were identified to Family (only), Genus (only) and Species level. For each family, the total number of photographic records is provided (Total), and also the number of species they represent (Sp. rec.).
Order
Family
Sp. in tax.
Family
Genus
Species
Total
Sp. rec.
Megaloptera
Corydalidae
14
0.0
0.0
0
0
0
Megaloptera
Sialidae
4
0.0
0.0
0
0
0
Neuroptera
Osmylidae
18
3.0
0.0
1
4
1
Neuroptera
Nemopteridae
87
0.0
32.0
56
88
11
Neuroptera
Mantispidae
100
49.0
7.0
6
62
2
Neuroptera
Dilaridae
1
0.0
0.0
0
0
0
Neuroptera
Psychopsidae
10
0.0
2.0
42
44
4
Neuroptera
Myrmeleontidae
462
51.0
393.0
1,441
1,885
88
Neuroptera
Hemerobiidae
55
8.0
18.0
19
45
8
Neuroptera
Coniopterygidae
100
1.0
0.0
0
1
0
Neuroptera
Chrysopidae
200
217.0
127.0
184
528
25
Neuroptera
Rhachiberothidae
11
0.0
0.0
0
0
0
Neuroptera
Berothidae
30
0.0
8.0
0
8
0
Neuroptera
Ascalaphidae
146
26.0
26.0
136
188
25
Neuroptera
Sisyridae
11
0.0
0.0
0
0
0
Totals
1,249
355.0
613.0
1,885
2,853
164
Percentages
12.4
21.5
66.1
100.0
NA
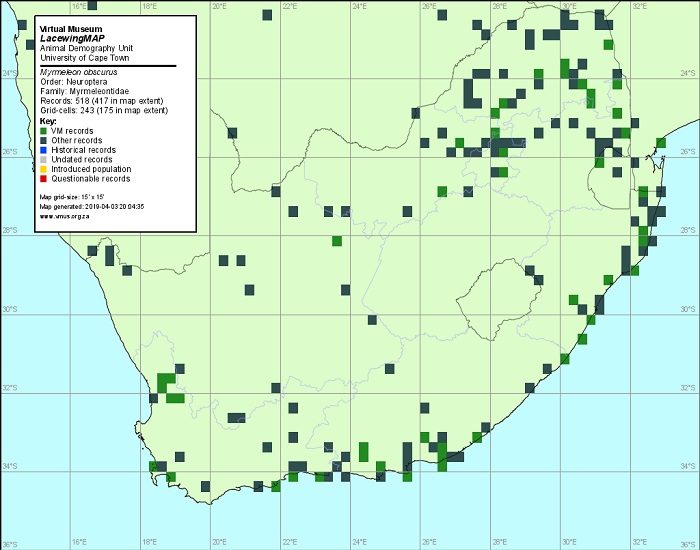
Of the 1,249 species in the taxonomy, the overall LacewingMAP database (specimens and photographs) contained records for 952 on 31 March 2019. 20 species had 148 or more records, of which 18 were members of the family Myrmeleontidae (Table 6). The two species with the most records were Myrmeleon obscurus (518) and Hagenomyia tristis (516) (Figures 1 and 2). The distribution maps for these two species within South Africa, Lesotho and Swaziland (Figures 6 and 7) show distinctly different patterns: it seems probable that Myrmeleon obscurus occurs throughout South Africa (Figure 6), but that Hagenomyia tristis is confined to the eastern half of the country (Figure 7).
Table 6. The 20 species with the largest numbers of records in the LacewingMAP database (specimen and photographic records combined) on 31 March 2019. The first column provides the species codes used in the Virtual Museum database.
Species code
Family
Species
Records
328640
Myrmeleontidae
Myrmeleon obscurus
518
328240
Myrmeleontidae
Hagenomyia tristis
516
327920
Myrmeleontidae
Cueta trivirgata
456
329340
Myrmeleontidae
Palpares caffer
395
327380
Myrmeleontidae
Banyutus lethalis
360
327780
Myrmeleontidae
Creoleon mortifer
350
328560
Myrmeleontidae
Myrmeleon alcestris
272
327540
Myrmeleontidae
Centroclisis brachygaster
252
328960
Myrmeleontidae
Nesoleon boschimanus
249
328220
Myrmeleontidae
Hagenomyia lethifer
243
329060
Myrmeleontidae
Neuroleon chloranthe
235
328360
Myrmeleontidae
Macroleon quinquemaculatus
230
328580
Myrmeleontidae
Myrmeleon doralice
228
327900
Myrmeleontidae
Cueta punctatissima
226
331520
Psychopsidae
Silveira marshalli
182
329520
Myrmeleontidae
Palpares sobrinus
174
321140
Ascalaphidae
Proctarrelabis involvens
163
329560
Myrmeleontidae
Palpares speciosus
163
328320
Myrmeleontidae
Lachlathetes moestus
155
327740
Myrmeleontidae
Creoleon diana
148
Fig 6. Distribution map for Myrmeleon obscurus (Figure 1) in South Africa, Lesotho and Swaziland.
Fig 7. Distribution map for Hagenomyia tristis (Figure 2) in South Africa, Lesotho and Swaziland.
All 12,898 records in the specimen database are identified to species. Species level identification from photographs is not always possible because many lacewings, and especially the species of “green lacewings” of the family Chrysopidae, can only be identified by dissection.
By 31 March 2019, we had undertaken identifications of 2,853 of the 2,883 photographic records submitted by citizen scientists. This provides a large sample of records from which we can attempt to quantify the extent of the identification issues. 1,885 of the 2,853 records (66.1%) were identified to species level, 613 (21.5%) to genus level only, and 355 (12.4%) to family level only (Table 5). Of those identified to family level only, 217 records (61%) were Chrysopidae (green lacewings), 50 records (14%) were Myrmeleontidae (antlions) and 49 records (14%) were Mantispidae (mantidflies) (Table 5).
Of the 613 records identified to genus level only (Table 5), 348 belonged to five genera: 105 in the genus Chrysoperla in the family Chrysopidae, and 83, 79, 67, and 55 in the genera Centroclisis, Cueta, Myrmeleon and Creoleon, respectively, of the family Myrmeleontidae (antlions). In summary, the green lacewings, i.e. the family Chrysopidae and especially the genus Chrysoperla within this family, and four genera within the family Myrmeleontidae (antlions) present the largest identification challenges from photographs.
In the photographic database, of the 22 species with more than 20 records (Table 7), 15 are also in Table 6, the top 20 species overall. There is one species in Table 7 for which more than half of all records are photographic: Dichochrysa tacta (recently renamed Pseudomallada tactus) has 43 photographic records and 41 specimen records. The distribution map (Figure 8) demonstrates how the photographic records are helping to “fill in” the range suggested by the specimen records.
Table 7. The 22 species with with more than 20 photographic records in the LacewingMAP database on 31 March 2019. The first column provides the species codes used in the Virtual Museum database.
Species code
Family
Species
Records
328240
Myrmeleontidae
Hagenomyia tristis
154
327380
Myrmeleontidae
Banyutus lethalis
146
328640
Myrmeleontidae
Myrmeleon obscurus
124
329340
Myrmeleontidae
Palpares caffer
116
327780
Myrmeleontidae
Creoleon mortifer
66
327920
Myrmeleontidae
Cueta trivirgata
51
328360
Myrmeleontidae
Macroleon quinquemaculatus
60
328220
Myrmeleontidae
Hagenomyia lethifer
47
328320
Myrmeleontidae
Lachlathetes moestus
43
323500
Chrysopidae
Dichochrysa tacta
43
327900
Myrmeleontidae
Cueta punctatissima
43
329520
Myrmeleontidae
Palpares sobrinus
42
329560
Myrmeleontidae
Palpares speciosus
38
322860
Chrysopidae
Chrysemosa jeanneli
34
329060
Myrmeleontidae
Neuroleon chloranthe
30
328560
Myrmeleontidae
Myrmeleon alcestris
29
320900
Ascalaphidae
Eremoides bicristatus
29
328580
Myrmeleontidae
Myrmeleon doralice
26
329440
Myrmeleontidae
Palpares inclemens
25
327880
Myrmeleontidae
Cueta mysteriosa
23
328960
Myrmeleontidae
Nesoleon boschimanus
23
320560
Ascalaphidae
Ascalaphus bilineatus
21
Fig 8. Distribution map for Dichochrysa tacta, recently renamed Pseudomallada tactus, in South Africa, Lesotho and Swaziland. Orange squares denote grid cells having specimen records, and turquoise circles denote grid cells having photographic records.
The genus Dichochrysa (now Pseudomallada) is part of the family Chrysopidae, the green lacewings, for which identifications are generally difficult. However, along with the genus Italochrysa, most photographic records for both genera were identified to species (88% and 86%, respectively) (LacewingMAP database).
Who are the main contributors of photographic records to the LacewingMAP database?
By March 2019, 234 people had submitted records to LacewingMAP; 36 had submitted more than 20 records (Table 8). It is true to state that none of these 36 people have a primary interest in the lacewings (in the way that people have primary interests in a particular taxon, such as birds, butterflies, reptiles, dragonflies and damselflies, or even spiders or scorpions). 90 people had submitted a single record, and the median number of submissions per observer was three. The Virtual Museum had a total of 2,256 observers on 31 March 2019. Only eight of the 234 participants in LacewingMAP had submitted records only to this section of the Virtual Museum (seven had submitted one record, and one person had submitted 12, the only specialist LacewingMAPper). For 98.8% of the 2,256 Virtual Museum participants, submissions to LacewingMAP were less than 10% of their total numbers of records submitted. These observations suggest that photographic records are submitted to LacewingMAP opportunistically, as they are encountered. The lacewings are an extremely valuable by-catch.
Table 8. 36 citizen scientists had submitted 20 or more photographic records to LacewingMAP in the period September 2014 to March 2019.
Citizen scientist
Records
Altha Liebenberg
235
Ryan Tippett
193
Gary Brown
161
Vaughan Jessnitz
130
Zenobia van Dyk
107
Alan Manson
102
Dewald du Plessis
90
Kate Braun
81
Pieter Cronje
76
Craig Peter
76
Bernardine Altenroxel
70
Christopher Willis
68
Len de Beer
67
James Harrison
53
Norman Barrett
51
John Wilkinson
46
Luke Kemp
45
Johan Heyns
44
Neil Thomson
39
Sonja Maartens
36
Corné Rautenbach
34
Marita Beneka
33
Les Underhill
32
Rob Dickinson
30
Ross Hawkins
30
Joseph Heymans
30
Fanie Rautenbach
30
Joubert Heymans
28
Quartus Grobler
27
Gert Myburgh
27
Michael Holden
26
Johnstone, Richard Alan
26
Hodgson, Andrew & Heather
24
Dawie de Swardt
23
Joan Young
22
Dave Kennedy
21
What are some of the interesting photographic records in LacewingMAP?
LacewingMAP has contributed many interesting and valuable locality records. It has added a vast number of new locality records and has contributed to our overall knowledge of the distribution of Afrotropical lacewings. Thus it is difficult to single out individual records.
Two records, both from 2018, are outstanding. They highlight the value of the contribution being made by citizen scientists.
LacewingMAP record 15379 is a specimen from Lüderitz Peninsula, southwestern Namibia, on 24 July 2018 (Figure 9). It belongs to the the genus Palmipenna. It is doubtless an undescribed species, remarkable for its early appearance (July) and its close proximity to the sea. This record was a total surprise. It is the farthest north that this genus has ever been recorded, and the second record of this genus from Namibia. Previous records of this genus were almost exclusively from the Western Cape, South Africa.
Fig 9. LacewingMAP record 15379, which is probably a new species in the genus Palmipenna, from the Lüderitz Peninsula, Namibia. It was submitted by Jessica Kemper, and further details are at http://vmus.adu.org.za/?vm=LacewingMAP-15379
LacewingMAP record 10583 is a specimen of a new antlion (Myrmeleontidae), either in the genus Fadrina or the genus Centroclisis (Figure 10). It cannot be placed with certainty; it has characteristics of both, and also remarkable for its small size. Provisionally, it is placed in Fadrina because of the double costal series in the forewings. This lacewing was found in the Cederberg area on 22 January 2018. This photographic record alerts us to the existence of a previously unknown taxon. It also emphasizes the exceptional lacewing diversity of the Cederberg.
Fig 10. LacewingMAP record 10583, which is probably a new species in the genus Fadrina, from the Cederberg area, Western Cape. It was submitted by Zenobia van Dyk and further details are at http://vmus.adu.org.za/?vm=LacewingMAP-10583
What are the priorities for fieldwork for LacewingMAP?
The answer to this is simple. At this stage in the life-cycle of the LacewingMAP project every record, from anywhere in Africa, is valuable.
How do I participate in LacewingMAP?
In a nutshell, the protocol is simple. Take photographs of lacewings, and upload them to the LacewingMAP section of the Virtual Museum website. There is no need to identify the species in the photograph. This gets done by the expert panel for LacewingMAP.
The easiest way to take photographs of lacewings is to be aware that they are attracted to light at night, in exactly the same way that moths are, although usually in far smaller numbers. The entire spectrum of cameras are used to take photographs of lacewings; the most versatile for this type of photography are the new generation of “compact” cameras
Once you are registered, you log on to the website using your email address and password. A “Data upload” section now becomes visible. The critical information that needs to be uploaded into the database is date, place and a series of one to three photographs of a single species, usually different angles on the same individual. Guidance on the upload process is provided in this slide show: https://www.slideshare.net/Animal_Demography_Unit/how-to-submit-records-to-the-virtual-museums
We do our best to identify each record to species level. As described earlier, this is difficult to achieve for several of the lacewing families, and especially for the green lacewings. But this should not deter you from submitting photographs. As a beginner participant, the best strategy for a positive confirmed identification is to take lots of photos of a specimen, and to select the best one, two or three photographs for submission, preferably from different angles. It is helpful to try to get different parts of the specimen in sharp focus in the three pictures.
Acknowledgements
We thank all the contributors to the LacewingMAP project for their photographs, and all those who collected specimens over the years, upon which the original dataset is based. We gratefully acknowledge the South African Biodiversity Information Facility (SABIF), the Global Biodiversity Information Facility (GBIF) and especially the JRS Biodiversity Foundation, Seattle, USA, for supporting the databasing of Afrotropical lacewings, which underpins this project. Museum specimen records were (and continue to be) assembled by MM. The expert panel for LacewingMAP is lead by MM, who evaluates all photographic submissions and attempts to assign records to species level.
References
Bates MF, Branch WR, Bauer AM, Burger M, Marais J, Alexander GJ, de Villiers MS (eds) 2014. Atlas and Red List of the reptiles of South Africa, Lesotho and Swaziland. Suricata 1. Pretoria: South African National Biodiversity Institute.
Erasmus BFN, Kshatriya M, Mansell MW, Chown SL, Van Jaarsveld AS 2000. A modelling approach to antlion (Neuroptera: Myrmeleontidae) distribution patterns. African Entomology 8: 157-168.
Freitag S, Mansell M 1997. The distribution and protection status of selected antlion species (Neuroptera: Myrmeleontidae) in South Africa. African Entomology 5: 205-216.
Mansell MW 2002. Monitoring lacewings (Insecta: Neuroptera) in southern Africa. Acta Zoologica Academiae Scientiarum Hungaricae 48 (Suppl. 2): 165-173.
Mansell MW, Kenyon B 2002. The Palpares relational database: an integrated model for lacewing research. Acta Zoologica Academiae Scientiarum Hungaricae 48 (Suppl. 2): 185-195.
Mecenero S, Ball JD, Edge DA, Hamer ML, Henning GA, Krüger M, Pringle EL, Terblanche RF, Williams MC (eds) 2013. Conservation assessment of butterflies of South Africa, Lesotho and Swaziland: Red List and atlas. Johannesburg: Saftronics and Cape Town: Animal Demography Unit.
New TR 1975. The biology of Chrysopidae and Hemerobiidae (Neuroptera), with reference to their usage as biocontrol agents: a review. Ecological Entomology 127: 115-140.
Winterton SL, Hardy NB, Wiegmann BM 2010. On wings of lace: phylogeny and Bayesian divergence time estimates of Neuropterida (Insecta) based on morphological and molecular data. Systematic Entomology 35: 349-378.


 The Mwamba Conservation Centre is just inside the eastern boundary of


 One of the participants on the course was Laban Njoroge, who is the entomologist at the museum. The museum’s collection of insects was on the same floor as our course venue, so Laban had the shortest distance between his office and the course! In the course WhatsApp group, Laban told us about the Jackson whose name is attached to this chameleon: “This man Jackson was a seasoned and passionate naturalist. In one of the AGMs of the then East African Natural History Society (now