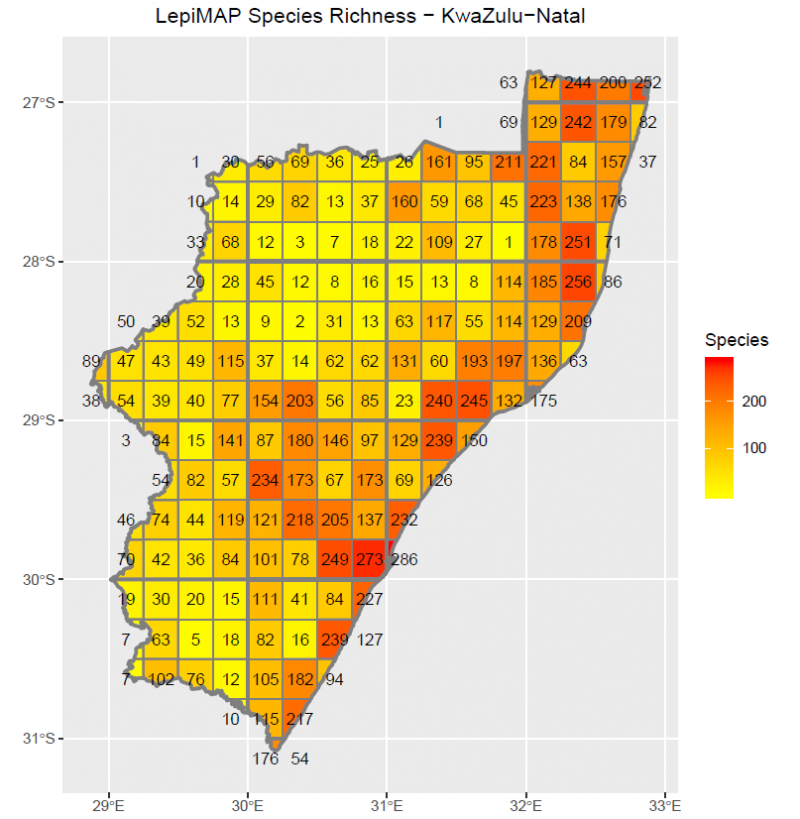
This map shows the number of bird species recorded per quarter degree grid cell in BirdPix in KwaZulu-Natal. The darker the shade, the more species. See the bar on the right.
Species richness in coastal KwaZulu-Natal, and through the Midlands to the foothills of the Drakensberg, is generally impressive. Five grid cells have more than 200 species. These set the standard that we should be aiming at! Another 28 grid cells have between 100 and 200 species. In the northeast, quarter degree grid cell 2729DD Newcastle, with 143 species stands head and shoulders above its neighbours. This was the initiative of citizen scientist Dave Rimmer while he was based there.
This map shows the number of bird species recorded per quarter degree grid cell in BirdPix in KwaZulu-Natal in the past year, since 1 April 2019. The darker the shade of blue, the more species. See the bar on the right. The colour coding is chosen to be different from the previous map, so there is no confusion between them.
Five grid cells have received records for 100 or more species in the past year, and there are another 17 with 50 to 99. This is great because it helps keep the database up-to-date. In the northwest, only two grid cells have received records in the past 12 months.
This map shows the date on which each quarter degree grid cell was last visited and had a record uploaded to BirdPix in KwaZulu-Natal. You determine the year from the colour bar on the right, and the month is given inside the grid cell. Blank cells have not got any BirdPix records yet.
The dominant colour on this map is blue. There is lots of dark blue. These quarter degree grid cells have all had 2020 records, in January, February or March! All the light blue grid cells have records from last year, 2019. There is a patch dominated by the shades of green in the northwest, where the last records date from 2018 and earlier years. This should be a focus of attention!
The first blog in this series dealt with BirdPix in the three “Cape” provinces. It also had an introduction that won’t be repeated here. All that needs to be said is that BirdPix is really important, and we are wanting to grow the database rapidly. The third blog focuses on KwaZulu-Natal.
This second blog covers BirdPix progress up to 4 April 2020 in the five northern provinces of South Africa: Limpopo, Mpumalanga, Gauteng, North West and Free State. There are three maps for each province, with Mpumalanga and Gauteng plotted together. So that means there is a total of 12 maps. The maps were prepared by Karis Daniels and Itxaso Quintana. Rene Navarro wrote the amazing query that extracts the data. The blog is first published with just the maps, and a paragraph of text for each will be added later!
Limpopo
This map shows the number of bird species recorded per quarter degree grid cell in BirdPix in Limpopo. The darker the shade, the more species. See the bar on the right.
The top BirdPix grid cell in Limpopo is 2430BD Hoedspruit, with (currently) 428 records and 159 species. 15 grid cells have more than 100 species. There are lots of grid cells with no records, or just a handful of records! Lots of opportunities here to strengthen the BirdPix database.
This map shows the number of bird species recorded per quarter degree grid cell in BirdPix in Limpopo in the past year, since 1 April 2019. The darker the shade of blue, the more species. See the bar on the right. The colour coding is chosen to be different from the previous map, so there is no confusion between them.
A lot of the submissions to BirdPix since April 2019 have been from the Kruger National Park, along the eastern edge of Limpopo. But pride of place goes to grid cell 2229AB, which includes the key parts of the Mapungubwe National Park. Overall, this grid cell has 133 records of 97 species, of which this map shows that 73 have been recorded since April 2019.
This map shows the date on which each quarter degree grid cell was last visited and had a record uploaded to BirdPix in Limpopo. You determine the year from the colour bar on the right, and the month is given inside the grid cell. Blank cells have not got any BirdPix records yet.
Please try to make more grid cells in this map dark blue, with 2020 visits. If you are locked down in a grid cell in Limpopo, you can make a valuable contribution to BirdPix from wherever you are.
Mpumalanga and Gauteng
These maps for these two provinces are combined. Gauteng is at the western end of each map.
This map shows the number of bird species recorded per quarter degree grid cell in BirdPix in Mpumalanga and Gauteng. The darker the shade, the more species. See the bar on the right.This map shows the number of bird species recorded per quarter degree grid cell in BirdPix in Mpumalanga and Gauteng in the past year, since 1 April 2019. The darker the shade of blue, the more species. See the bar on the right. The colour coding is chosen to be different from the previous map, so there is no confusion between them.This map shows the date on which each quarter degree grid cell was last visited and had a record uploaded to BirdPix in Mpumalanga and Gauteng. You determine the year from the colour bar on the right, and the month is given inside the grid cell. Blank cells have not got any BirdPix records yet.
We’ll write a paragraph for each map as soon as we can.
North West
This map shows the number of bird species recorded per quarter degree grid cell in BirdPix in North West. The darker the shade, the more species. See the bar on the right.
Coverage of the western half of North West is pretty dismal! This is common to every citizen science project. The reason is that is not an easy area to access. If anyone has photos of birds from here in their personal archives, please upload them to BirdPix. Coverage in the eastern half is more promising. The bar is set by grid cell 2626DC Klerksdorp, where citizen scientist extraordinary Tony Archer, is very active. This grid cell has 1104 records, which cover 220 species.
This map shows the number of bird species recorded per quarter degree grid cell in BirdPix in North West in the past year, since 1 April 2019. The darker the shade of blue, the more species. See the bar on the right. The colour coding is chosen to be different from the previous map, so there is no confusion between them.
No species have been recorded in the western half of North West since April 2019. Of the 220 species ever recorded in Tony Archer’s grid cell at Klerksdorp, 151 have been recorded in the past year. Tony has kept refreshing species here.
This map shows the date on which each quarter degree grid cell was last visited and had a record uploaded to BirdPix in North West. You determine the year from the colour bar on the right, and the month is given inside the grid cell. Blank cells have not got any BirdPix records yet.
Many quarter degree grid cells in the eastern half of North West are either dark blue or light blue. That’s encouraging, please keep up the good work.
Free State
This map shows the number of bird species recorded per quarter degree grid cell in BirdPix in the Free State. The darker the shade, the more species. See the bar on the right.This map shows the number of bird species recorded per quarter degree grid cell in BirdPix in the Free State in the past year, since 1 April 2019. The darker the shade of blue, the more species. See the bar on the right. The colour coding is chosen to be different from the previous map, so there is no confusion between them.This map shows the date on which each quarter degree grid cell was last visited and had a record uploaded to BirdPix in the Free State. You determine the year from the colour bar on the right, and the month is given inside the grid cell. Blank cells have not got any BirdPix records yet.
This is the first of a series of blogs on BirdPix. This one covers the Western, Eastern and Northern Cape provinces of South Africa. For each province, it answers three questions: (1) How well is BirdPix doing overall? (2) How well has BirdPix done in the past year, since 1 April 2019? (3) When was each quarter degree grid cell last visited? We’ll tackle the remaining six provinces for BirdPix as separate blogs (KwaZulu-Natal and the five northern provinces) and then move on to other sections of the Virtual Museum.
Why is BirdPix so important? Right now, MSc student Karis Daniel is using the BirdPix maps to “model” the full distributions of species. All bird species, even the most common, have quite scruffy datasets. This is true to a greater or lesser extent for every species in the Virtual Museum. None of the maps is “complete”, there are lots of “false negatives”, places where the species MUST occur (because it is in most of the surrounding grid cells, which have similar habitat). We discussed “false negatives” here. In contrast, the distribution maps for the bird atlas, SABAP2, are virtually complete for many species. The bird atlas does not yet have full coverage, but there are lots of species for which the entire range is covered. The idea for Karis’s project is to use the statistical methods called “species distribution models” to generate complete maps out of the BirdPix data, and to find the method which comes closest to generating the “truth”, as defined by the bird atlas. If she can find a method that works for the BirdPix data, then we can apply it to the LepiMAP data, to the ReptileMAP data, to the FrogMAP data, to the ScorpionMAP data. All these projects have generated incomplete datasets, with lots of false negatives. The distributions are not complete.
What’s needed now for BirdPix is to get the database more comparable in size to that of, say, LepiMAP or OdonataMAP. There are three maps for each province. The first shows overall coverage, measured as species richness, the number of species recorded in the BirdPix database per quarter degree grid cell. The second map shows the total number of species recorded in the past year, from 1 April 2019 to 6 April 2020. This gives insight into how up to date the records are. The third map tells us when each grid cell was last visited. Let’s go.
Western Cape
This map shows the number of bird species recorded per quarter degree grid cell in BirdPix in the Western Cape. The darker the shade, the more species. See the bar on the right.
The grid cell in the Western Cape with the most species is 3219AA Clanwilliam. 194 species have been photographed here. The citizen scientist responsible for setting this bar so high is Zenobia van Dyk. If Zenobia can find 194 species in pretty difficult habitat mostly in the Cederberg Mountains, then the rest of us ought to be doing a lot better everywhere else. Even the Cape Town grid cell 3318CD, with the advantages of (a) habitat for seabirds, shorebirds and wetland birds, and (b) lots of observers, only has 175 species. [If you have difficulty going between the codes for the grid cells and the map, you need to study the blog on quarter degree grid cells carefully!]
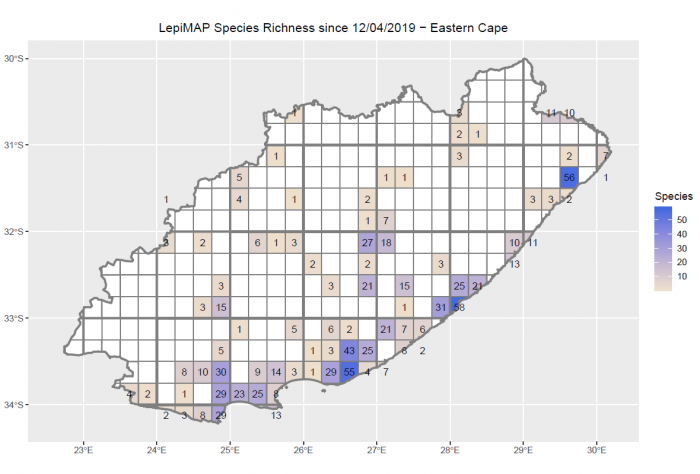
This map shows the number of bird species recorded per quarter degree grid cell in BirdPix in the Western Cape in the past year, since 1 April 2019. The darker the shade of blue, the more species. See the bar on the right. The colour coding is chosen to be different from the previous map, so there is no confusion between them.
This map shows the number of species recorded in each grid cell in the past year, since the beginning of April 2019. Many of the records were “refreshments” of old records. These are incredibly important, because they confirm the continued presence of a species in a grid cell. A very large number of the records made in this period were the first records in BirdPix for the species. This map is pretty impressive. And so is the next one …
This map shows the date on which each quarter degree grid cell was last visited and had a record uploaded to BirdPix in the Western Cape. You determine the year from the colour bar on the right, and the month is given inside the grid cell. Blank cells have not got any BirdPix records yet.
All grid cells shaded dark blue have had at least one record submitted to BirdPix in 2020. And we are three months into the year. Those which are light blue have their most recent record from 2019. It is amazing that most grid cells with data have records from the past 15 months. The shades of greens and yellow (last visited 2013-2018), the pink grid cell (3320DA Kareevlakte, last visit in June 2012), and of course the blank grid cells are priorities for visits. But the overall impression for the Western Cape is how blue it is! Well done, BirdPixers.
Eastern Cape
We follow the same pattern as for the Western Cape.
This map shows the number of bird species recorded per quarter degree grid cell in BirdPix in the Eastern Cape. The darker the shade, the more species. See the bar on the right.
Grid cell 3125CA, just south of Middelburg, has 202 BirdPix species. Tino Herselman is the citizen scientist responsible for the excellent coverage of this and the surrounding quarter degree grid cells. 3424BB has 175 species, the photographic handiwork of Desire and Gregg Darling; this grid cell contains Cape St Francis and the estuary of the Kromrivier. BirdPix needs some more champions in the Eastern Cape.
This map shows the number of bird species recorded per quarter degree grid cell in BirdPix in the Eastern Cape in the past year, since 1 April 2019. The darker the shade of blue, the more species. See the bar on the right. The colour coding is chosen to be different from the previous map, so there is no confusion between them.
Grid cell 3324AD, which had 127 species in the previous map, has none in this map! Pam Kleiman, who was the BirdPixer here, has moved to grid cell 2929DA in the foothills of the Drakensberg in KwaZulu-Natal, where she continues to make an awesome contribution to BirdPix. We need someone in Steytlerville to take over Pam’s role, and keep the records for the grid cell refreshed and up-to-date.
This map shows the date on which each quarter degree grid cell was last visited and had a record uploaded to BirdPix in the Eastern Cape. You determine the year from the colour bar on the right, and the month is given inside the grid cell. Blank cells have not got any BirdPix records yet.
Please help keep this map blue, and preferably dark blue, by uploading your bird photos to the BirdPix section of the Virtual Museum. There is quite a lot of green and yellow at the western end of the Eastern Cape, and this is fixable. The eastern end of the Eastern Cape remains a big challenge for BirdPix, as it does for many citizen science projects.
Northern Cape
The Northern Cape is thinly populated. It is mostly arid, apart from narrow strips of riparian vegetation along the banks of the Orange and Vaal Rivers. Along sections of these rivers, there are also extensive irrigation schemes, which are green oases in semi-desert. For the past bunch of years, severe drought has impacted the province, heightening the contrast between the vast expanse of dryland and the tiny area of irrigated land. This is not an easy province to do citizen science in, and the temptation is to focus on the “green”. In arid grid cells, species richness is generally small, and especially so in the drought. Let’s have a peek and see how BirdPix has fared.
This map shows the number of bird species recorded per quarter degree grid cell in BirdPix in the Northern Cape. The darker the shade, the more species. See the bar on the right.
All things considered, coverage of the Northern Cape is not bad. There are some huge gaps, like the broad band of white running northeast from the northern corner of the Western Cape. Coverage in the southeast is good. This is where the Northern Cape touches Tino Herselman’s initiative in the Eastern Cape (see above). In this area is grid cell 3125AC, with 169 species, but it only has a sliver in the Northern Cape. So the grid cell entirely inside the Northern Cape with the most species is also in this area. 3024DC has 149 species. This grid cell contains the Karoo Gariep Nature Reserve, where the BDI Citizen Science Conference was held in February this year.
Two more prominent grid cells in the Northern Cape have resident citizen scientists. Altha Liebenberg is based in Danielskuil, in the northeast. 2823BA has 128 species. Ryan Tippett is on the farm Louievale north of Carnarvon, centre-south. 3022CA has 118 species. This demonstrates the incredible value of having dedicated citizen scientists based in grid cells. We desperately need more Althas and more Ryans!
We really do need the Virtual Museumers of Kimberley to focus their cameras on birds, and improve the BirdPix coverage. The city of Kimberley is split across four quarter degree grid cells: 2824DA has 16 species; 2824DB has 33; 2824DC has 22; and 2824DD also has 22. The initial target for each of these grid cells should be 100 species!
This map shows the number of bird species recorded per quarter degree grid cell in BirdPix in the Northern Cape in the past year, since 1 April 2019. The darker the shade of blue, the more species. See the bar on the right. The colour coding is chosen to be different from the previous map, so there is no confusion between them.
The visits by the BDI teams to the Karoo Gariep Nature Reserve in the past year (see here and here) generated 133 species in grid cell 3024DC. Two BioBashes have been held in the Northern Cape. The Calvinia BioBash in June 2019 is responsible for most of the records in the big rectangle in the southwest, and the Boegoeberg BioBash last October created the rectangle just east of centre. The Boegoeberg Dam lies in grid cell 2922AA with 80 species recorded in the past year; the total for the grid cell is 86 species, so there are only six species that have not been “refreshed”. The “caterpillar” of grid cells running northeastward from Calvinia towards Upington was created en route to the Boegoeberg BioBash, illustrating the value of the “road trip”.
This map shows the date on which each quarter degree grid cell was last visited and had a record uploaded to BirdPix in the Northern Cape. You determine the year from the colour bar on the right, and the month is given inside the grid cell. Blank cells have not got any BirdPix records yet.
It is impressive how much data collection for BirdPix has been done in 2019 and 2020. This map is mostly blue. Every record from the Northern Cape is precious, and this is true not only for BirdPix but for all the other citizen science projects.
The biggest barrier to interpreting these maps is getting to grips with finding your way around the six-character codes for the quarter degree grid cells. The clown who designed this complicated system should have been allowed to design one more thing only: his tombstone.
The first four characters are numbers, and tell us what degree cell we are in. Like reading a book, we start in the top-left corner, the northwest corner of the degree cell. The first pair of numbers are the degrees south and the second pair are degrees east. The degree cell below is 2830. The final two characters tell us the layout of the quarter degree grid cells within the degree square, as illustrated here.
To find the code for a grid cell in the maps above, first step is to establish the degree cell. The degree lines are drawn thick. So it is mostly easy to navigate the degree cells. Go to the top left hand corner. Follow the line to the left edge of the map, and find the degrees south. From the top left corner of the degree cell, follow the line to the bottom edge of the map, and find the degrees east. That gives you the degree square. Within the degree square, the diagram above shows you the two-letter code for the quarter degree grid cell you want.
The web address for getting the list of species for a grid cell has this pattern: http://vmus.adu.org.za/vm_locus_map.php?vm=birdpix&locus=2824DD. You can change the “locus” (=the place) to the code for any other quarter degree grid cell. And if you want the reptiles rather than the birds, change vm=birdpix to vm=reptilemap. Suppose you want the birds from the quarter degree grid cell at the mouth of the Orange River, in the extreme west of the Northern Cape. On the map, go to the top-left corner of the degree cell. It is at 28S and 16E. So the grid cell is 2816. It is in the third row from the top, and the second row from the left. From the diagram above, this is position CB. So the code is 2816CB. So let’s try http://vmus.adu.org.za/vm_locus_map.php?vm=birdpix&locus=2816CB. That’s right, and here is the map and the list of 25 species which have been recorded here!
Karis Daniel and Itxaso Quintana made the maps. Rene Navarro wrote the underlying query that enables these maps to be produced. Malcolm Robertson, Colin Summersgill, Lisl van Deventer and Garth Aiston do the major share of confirming identifications for BirdPix. Thank you.
These are trying times for all of us. It can be hard to stay focused, it can be hard to stay positive, but there are ways we can make the lockdown more bearable, and even fun! Connecting with nature is important, perhaps now more than ever. Nature is all around us if we take the time to notice (and right now all we have is time!). Connecting with nature has been proven to help us relax, reduce anxiety, and lift our spirits. Nature is good for us because we are part of nature.
Jewels of nature – have you seen this gorgeous butterfly in your garden? Now is the perfect time to discover the gems in and around your house. This beauty is known as a Gaudy Commodore or Rooi-en-blou-blaarvlerk. LepiMAP record by I.C. Riddell
If you have a garden, use the lockdown to explore your garden properly. Take your camera (cellphone, “mik-en-druk”, or DSLR, whatever suits your fancy) and see what you can find. Butterflies, dragonflies, damselflies, frogs, reptiles, moths, these are but a few of the critters that you might find in your green patch. Keep a species list, take photographs, and whip out all those field guides you’ve been meaning to give a proper read. Try to identify all your garden critters. And, of course, don’t forget to upload your photos to the different sections of the Virtual Museum (where the members of the expert panels will be happy to identify your finds for you).
Okay, so you don’t have a garden? No problem! Step out onto your balcony, or open the window, get some sunshine onto your face and take a deep breath. Grab your binoculars and LOOK! Make a bird list, make a tree list, or sketch the sunrise/sunset. Take photos of any birds that you might see and upload those to the Virtual Museum.
Virtual Museuming in lockdown. Estelle van Rooyen photographs the birds she can see from a window in her home in Stilbaai, Western Cape Province. We tend to go far afield when we search for biodiversity, but where we live tends to be neglected. This is the opportunity to rectify this!
If you don’t have a garden, you can still biomap! Take a wander inside your home, go on a safari in your living room, kitchen, bedroom. Take a closer look, make a game out of it and see who can snap and map the most species inside the house. What do you see? Perhaps you will find one of these, a Marbled Leaf-toed Gecko Afrogecko porphyreus (photo below). These awesome geckos are like your own personal pest control unit, keeping your home free of insects. Remember to upload your photos to ReptileMAP at http://vmus.adu.org.za/
Biomapping can help us all to stay sane and connect with nature. Thank you to all the citizen scientists who have taken on the challenge to biomap at home. You are awesome! Let us know what you find by uploading your discoveries to the Virtual Museum and by sharing your photos on social media. Stay safe, stay curious and stay calm.
Awesome citizen science teamwork for March 2020. Together we achieved BestMarch late on the evening of 30 March 2020! Now we have the whole of today to push the RED dot upwards, so that there is a big gap between it and the dot for March last year (see the graph below).
In spite of the setbacks of March, we continue to build species distribution maps. Please work through your backlogs, and please see what you can achieve in the locality you find yourself in now during the lockdown. Well done, Team Virtual Museum. Thank you. Stay sane, stay healthy and BioMAP at home.
Citizen Science: a solution to the problems of the 2020s?
We did this crazy exercise at the BDI Citizen Science Conference in the Karoo! An independent organization** made a list of “cultural” issues which might need a “shift” in our values and beliefs. We had a discussion in which we considered whether “citizen science” could help with awareness of these problems, and help provide a shift in the attitudes, values and beliefs! This is their full list, verbatim, unedited!
What we discussed ran like this. “In what ways can ‘citizen science’ (i.e. involvement with citizen science projects) help make a shift on how people see these issues? How can ‘citizen science’ change people’s attitudes values and beliefs. In what way does the organization of citizen science projects need to be adapted to help mitigate these issues?” At first glance, some of the topics seem far removed from “citizen science”. How on earth does “citizen science” interact with “hopelessness”? But this is the challenge. In the BDI, our focus is on both “citizen” and “science”. The “science” part is easy; trying to mitigate the real problems of the day, through citizen science, is going to stretch us.
Citizen science is about community, sharing knowledge, biodiversity stewardship… and having fun!
We are compiling a report on this discussion.
We are under lockdown, and many of us are wondering what sort of world and society we will emerge into on the other side. So this is a great opportunity for each of us to spend a bit of time thinking about these topics. We invite our readers to write a paragraph or more on these topics, and we will compile them into the report. Please email your ideas to Les Underhill (les [at] thebdi.org).
Disconnection from nature – Today, some see humanity as something apart from nature – not integral to it. And many believe this is what’s driven our civilization to the brink of environmental collapse. So we need to further cultivate the idea that we are one with nature – in fact we are nature defending itself.
Hopelessness – There is indeed a lot that needs changing in this world, but one barrier to making change is a feeling of hopelessness that seems to be rising across society. Let’s inspire hope in people so they believe in their own power to change their world.
Nationalism and division – Division and hate are overpowering social media. But we are one people, one love. Let’s counter nationalism with a global sense of community and commonality.
Anger and trigger – We all have things that steal our cool. We call them “triggers”. And when triggered, people act most often from anger and anxiety. We need to cultivate a culture of “untriggering” – taking a deep breath and acting from more self-aware emotions.
Rape and trauma – Recently, victims of sexual violence have used social media to tell their stories, and overcome shame and deep pain. One important next step is to focus on the pride of surviving trauma and giving people a network of online support.
Division and hate – We are living in a moment of deep division, and there are few public models for how to talk constructively to people on the other side of the political/ideological spectrum. What if we learned to be better in our ability to disagree with strength and kindness?
Sexism, men and toxic masculinity – Let’s open up a discussion about how we can raise little boys free from the toxic stories about what “real” men should be – often portrayed as unemotional or unfeeling.
Lack of inspiration – Our heroes sometimes feel too grand for us. We don’t feel like we, in our regular lives, can be great based on these stories. What if we found ordinary people who have risen to this moment and done incredible things, and share their stories to inspire others?
Screen addiction and loneliness – We are living an epidemic of screen addiction, disconnection and loneliness. Let’s support one another in unplugging more, and cultivating and appreciating real-life deeper connection.
**Avaaz is the organization whose survey we used. This non-profit organization has, since 2007, promoted global activism on issues such as climate change, human rights, corruption, poverty, biodiversity and conflict. It is probably the world’s largest and most powerful online activist network. Avaaz describes itself as a campaigning community bringing people-powered politics to decision-making worldwide.
One thing we can be grateful for in this crazy time is that migratory birds are not taking the blame for transporting COVID-19. The migrant birds are now on their way north. In the midst of this chaotic week, Magda Remisiewicz (University of Gdansk, Poland) and Les Underhill (UCT and BDI) had a paper published about a long-distant migrant, Willow Warblers. In Poland, there’s a migration study site on the coast of the Baltic Sea near a small town called Bukowo. At this site the birds flying north have sea on their left, and a lake on their right, and are funneled through a narrow strip of land. Researchers from the University of Gdansk, assisted by lots of citizen scientists, have mist netted migrants in spring using a standardized system for decades. They have generated one of the best datasets for investigating how the timing of migration has varied through time.
It has been well known for a long time that migration is getting earlier, and Willow Warbler migration at Bukowo is getting earlier too. What sets this paper apart is that it develops a statistical model that “explains” nearly 60% of the annual variation in the timing of migration. The “explanatory variables” in the model are the big climate indices (such as the Southern Oscillation Index, responsible for El Ninos). Although the model was given “Year” as an “explanatory variable”, it chose not to use this. “Year” was “redundant”. The pattern of migration getting generally earlier was “explained” better by the long term changes in the climate indices. The paper used data from 1982 to 2017.
Background. The arrival of many species of migrant passerine in the European spring has shifted earlier over recent decades, attributed to climate change and rising temperatures in Europe and west Africa. Few studies have shown the effects of climate change in both hemispheres though many long-distance migrants use wintering grounds which span Africa. The migrants’ arrival in Europe thus potentially reflects a combination of the conditions they experience across Africa. We examine if the timing of spring migration of a long-distance migrant, the Willow Warbler, is related to largescale climate indices across Africa and Europe. Methods. Using data from daily mistnetting from 1 April to 15 May in 19822017 at Bukowo (Poland, Baltic Sea coast), we developed an Annual Anomaly metric (AA, in days) to estimate how early or late Willow Warblers arrive each spring in relation to their multi-year average pattern. The Willow Warblers’ spring passage advanced by 5.4 days over the 36 years. We modelled AA using 14 potential explanatory variables in multiple regression models. The variables were the calendar year and 13 large-scale indices of climate in Africa and Europe averaged over biologically meaningful periods of two to four months during the year before spring migration. Results. The best model explained 59% of the variation in AA with seven variables: Northern Atlantic Oscillation (two periods), Indian Ocean Dipole, Southern Oscillation Index, Sahel Precipitation Anomaly, Scandinavian Index and local mean temperatures. The study also confirmed that a long-term trend for Willow Warblers to arrive earlier in spring continued up to 2017. Discussion. Our results suggest that the timing of Willow Warbler spring migration at the Baltic Sea coast is related to a summation of the ecological conditions they had encountered over the previous year during breeding, migration south, wintering in Africa and migration north. We suggest these large-scale climate indices reflect ecological drivers for phenological changes in species with complex migration patterns and discuss the ways in which each of the seven climate indices could be related to spring migration at the Baltic Sea coast.
Find the Sailing Bluet in the FBIS database (Freshwater Biodiversity Information System) here.
Family Coenagrionidae
Identification
Very small size
Length up to 28mm; Wingspan attains 33mm.
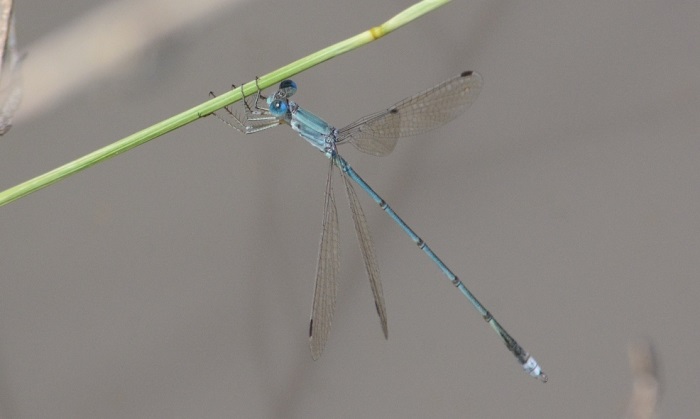
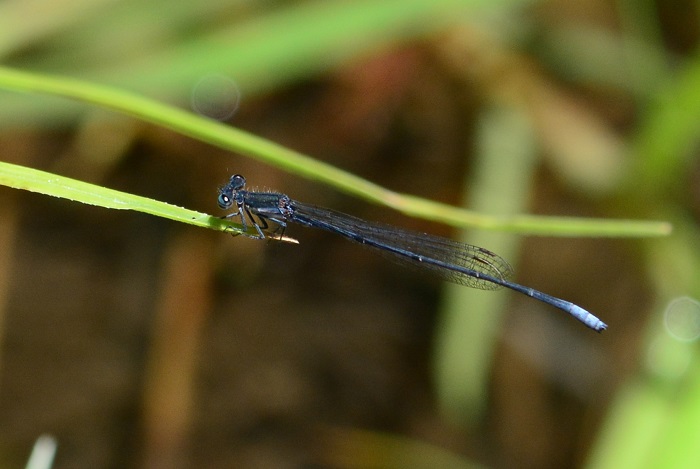
The Sailing Bluet is often found alongside the Swamp Bluet (Africallagma glaucum), but is easily differentiated by its deeper blue colouration and by the black protrusion onto the eighth segment of the abdomen.
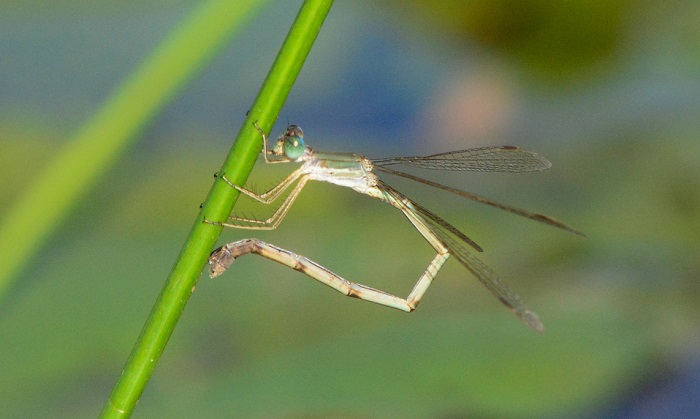
The females are similar to other Bluet females, and are best identified by their association with the males.
Sailing BluetAzuragrion nigridorsum – Male Near Hluhluwe, KwaZulu-Natal Photo by Ryan Tippett
Habitat
The Sailing Bluet frequents well-vegetated, still-water environments such as dams, ponds, marshes, and the quiet backwaters of rivers and streams. Azuragrion nigridorsum usually occupies areas with floating and emergent plants like waterlilies and sedges and is frequently found near floating mats of green algae.
Typical habitat – Near Hluhluwe, KwaZulu-Natal Photo by Ryan Tippett
Behaviour
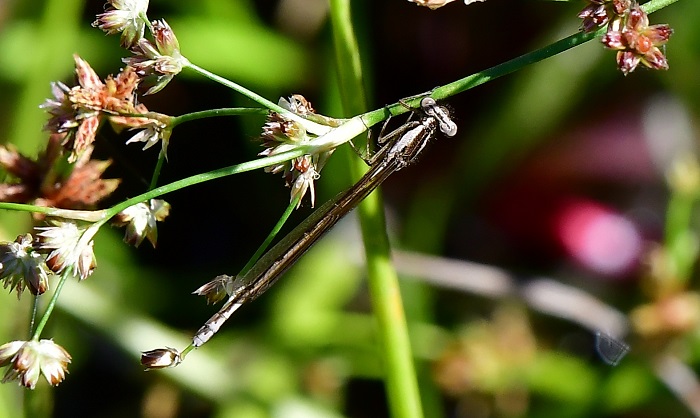
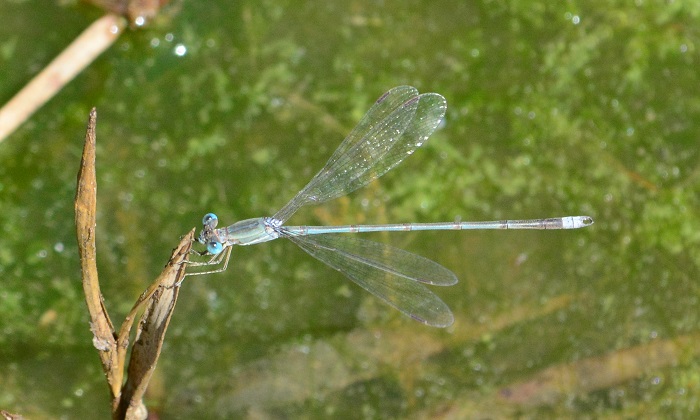
The Sailing Bluet is mostly found low down close to the water, where it perches on lily pads or emergent plants. The flight is fast and typically low over the water. When the weather is calm, the Sailing Bluet sometimes alights gently on the water without breaking the surface. They then drift across the pond in the breeze with their folded wings acting as sails (see image below). Females are often found in the same vicinity as the males.
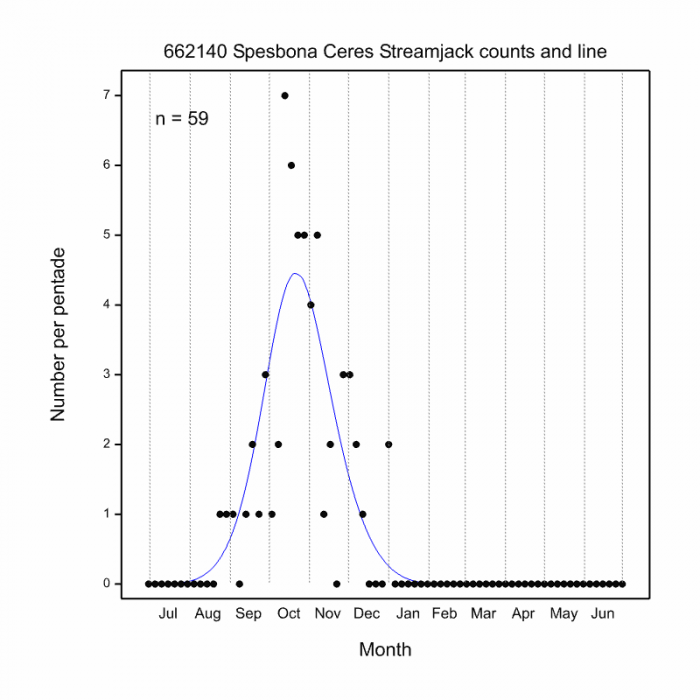
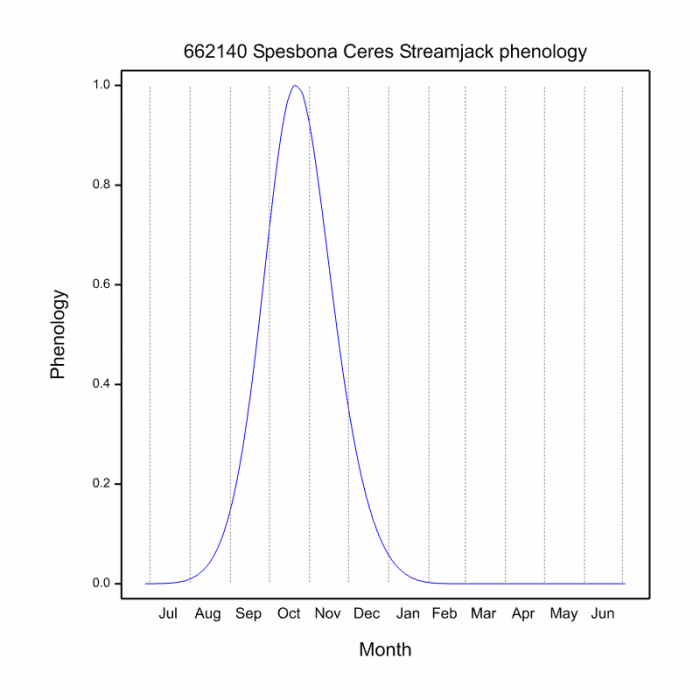
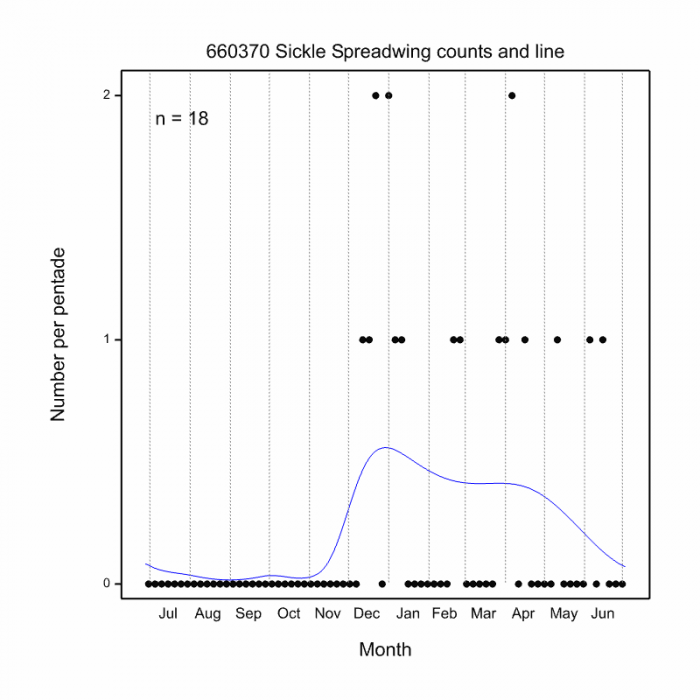
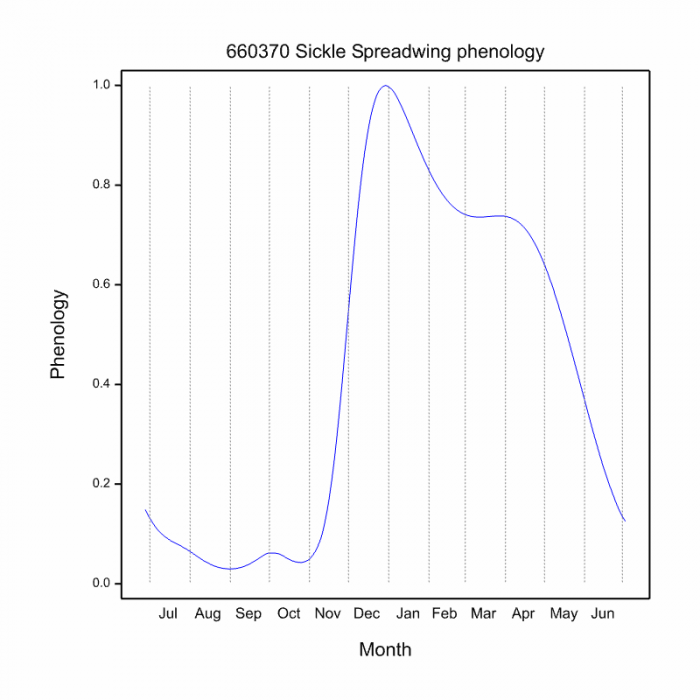
The Sailing Bluet is primarily active from October to April but flies year-round at some sites. See Phenology below.
Sailing BluetAzuragrion nigridorsum – Male Near Hluhluwe, KwaZulu-Natal Photo by Ryan Tippett
Status and Conservation
The sailing Bluet is a common and widespread species. It is listed as of Least Concern in the IUCN Red List of Threatened Species. Azuragrion nigridorsum is moderately sensitive to habitat damage, but has adapted well to man-made habitats and has doubtless benefited from this.
Sailing BluetAzuragrion nigridorsum – Male Near Hluhluwe, KwaZulu-Natal Photo by Ryan Tippett
Distribution
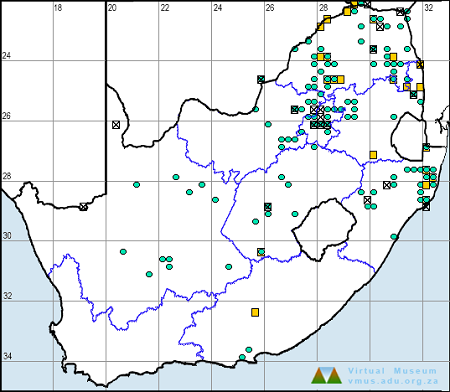
Azuragrion nigridorsum is found from Ethiopia in the north, down through most of East and Southern Africa, including Angola and Zambia. In South Africa it is mostly absent from the dry central region.
Sailing BluetAzuragrion nigridorsum – Male Near Hluhluwe, KwaZulu-Natal Photo by Ryan Tippett
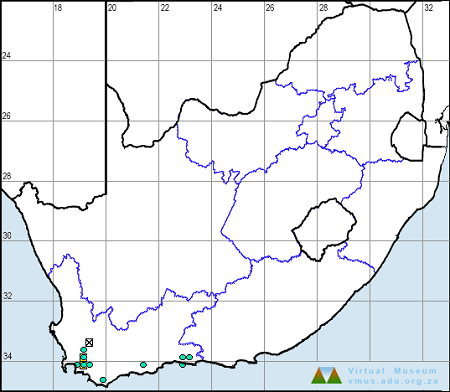
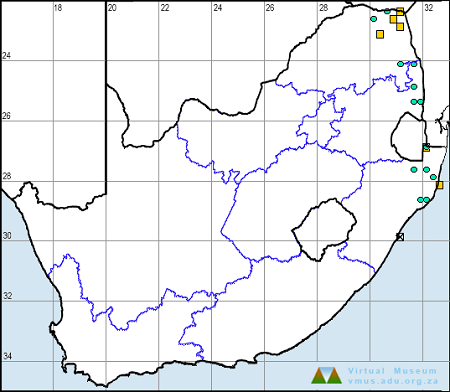
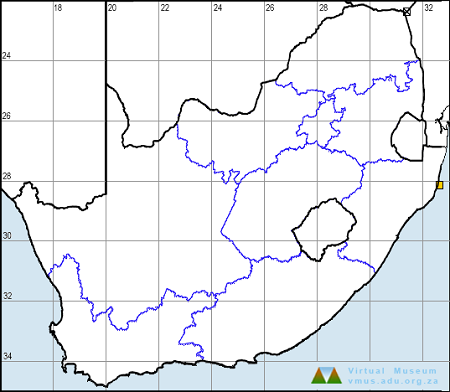
Below is a map showing the distribution of records for Sailing Bluet in South Africa. Taken from the OdonataMAP database as at February 2020.
Below is a map showing the distribution of records for Sailing Bluet in South Africa. Taken from the OdonataMAP database as of December 2024.
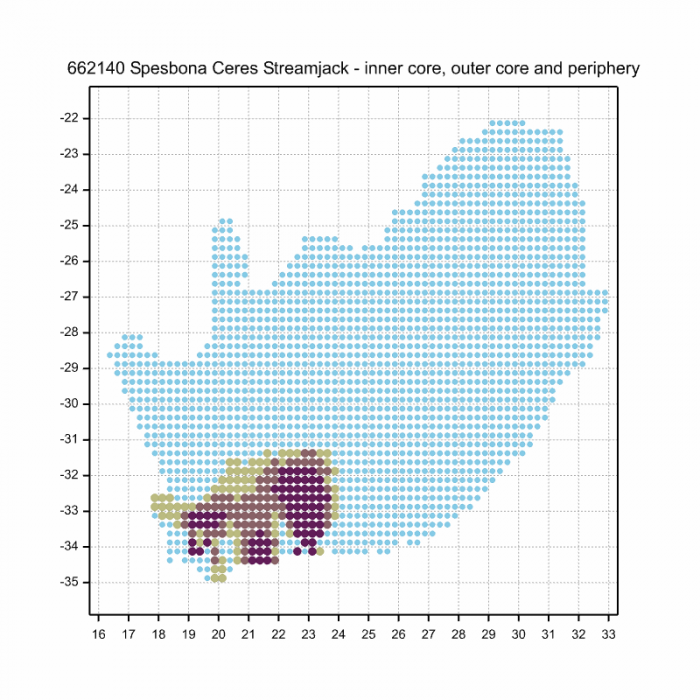
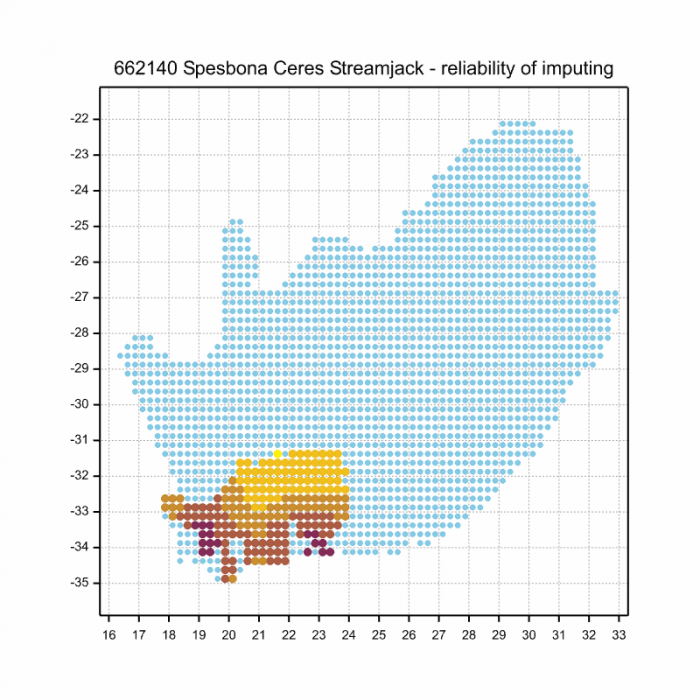
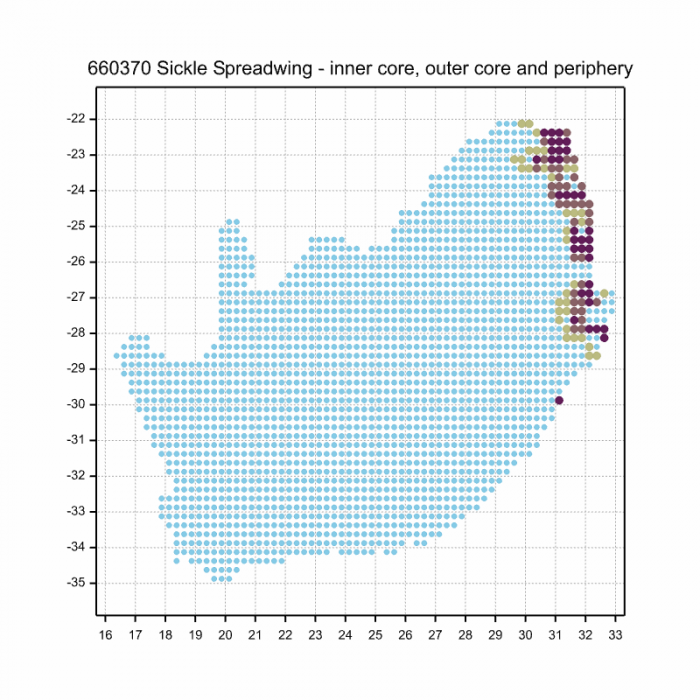
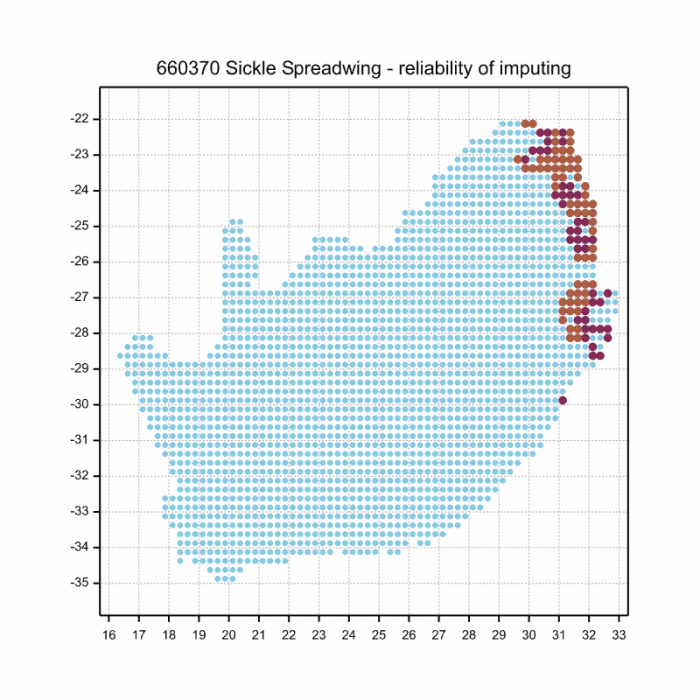
The next map below is an imputed map, produced by an interpolation algorithm, which attempts to generate a full distribution map from the partial information in the map above. This map will be improved by the submission of records to the OdonataMAP section of the Virtual Museum.
Ultimately, we will produce a series of maps for all the odonata species in the region. The current algorithm is a new algorithm. The objective is mainly to produce “smoothed” maps that could go into a field guide for odonata. This basic version of the algorithm (as mapped above) does not make use of “explanatory variables” (e.g. altitude, terrain roughness, presence of freshwater — we will be producing maps that take these variables into account soon). Currently, it only makes use of the OdonataMAP records for the species being mapped, as well as all the other records of all other species. The basic maps are “optimistic” and will generally show ranges to be larger than what they probably are.
These maps use the data in the OdonataMAP section of the Virtual Museum, and also the database assembled by the previous JRS funded project, which was led by Professor Michael Samways and Dr KD Dijkstra.
Sailing BluetAzuragrion nigridorsum – Male Photo by Felicity Grundlingh
Phenology
Sailing BluetAzuragrion nigridorsum – Pair Near Hluhluwe, KwaZulu-Natal Photo by Ryan Tippett
Further Resources
The use of photographs by Bernardine Altenroxel and Felicity Grundlingh is acknowledged. Other photographs by Ryan Tippett.
Sailing BluetAzuragrion nigridorsum(Selys, 1876)
Other common names: Black-tailed Bluet (Alt. English); Swartstertbloutjie (Afrikaans)
Recommended citation format: Loftie-Eaton M; Navarro R; Tippett RM; Underhill L. 2025. Sailing Bluet Azuragrion nigridorsum. Biodiversity and Development Institute. Available online at https://thebdi.org/2020/03/20/sailing-bluet-azuragrion-nigridorsum/
References: Tarboton, M; Tarboton, W. (2019). A Guide to the Dragonflies & Damselflies of South Africa. Struik Nature.
Samways, MJ. (2008). Dragonflies and Damselflies of South Africa. Pensoft
Samways, MJ. (2016). Manual of Freshwater Assessment for South Africa: Dragonfly Biotic Index. Suricata 2. South African National Biodiversity Institute, Pretoria
Martens, A; Suhling, F. (2007). Dragonflies and Damselflies of Namibia. Gamsberg Macmillan.
Sailing BluetAzuragrion nigridorsum – Male Near Hluhluwe, KwaZulu-Natal Photo by Ryan Tippett
Find the Orange Wisp in the FBIS database (Freshwater Biodiversity Information System) here.
Family Coenagrionidae
There are two distinct subspecies of the Orange Wisp in southern Africa, Agriocnemis ruberrima ruberrima (NE South Africa) and Agriocnemis ruberrima albifrons (Botswana to Angola and Zambia). Further studies may determine that the two are, in fact, separate species.
This species text deals mainly with the South African subspecies Agriocnemis ruberrima ruberrima.
Identification
Orange WispAgriocnemis ruberrima ruberrima – Male Kosi Bay, iSimangaliso Wetland Park, KwaZulu-Natal Photo By Ryan Tippett
Tiny size
Length reaches 23mm; Wingspan up to 28mm.
Adult males of the South African subspecies are readily identifiable due to the near luminous, all-orange-red abdomen.
Females are very similar in appearance to other Agriocnemis species, especially the Little Wisp (Agriocnemis exilis) and are best told by their association with the males.
Orange WispAgriocnemis ruberrima ruberrima – Female Kosi Bay, iSimangaliso Wetland Park, KwaZulu-Natal Photo By Ryan Tippett
Habitat
The Orange Wisp inhabits the shallow, grassy fringes of seasonal ponds, pans, and marshes. It is most often found in mosaic habitats consisting of open, coastal grassland and forest.
Habitat – Near Kosi Bay, KwaZulu-Natal Photo by Ryan Tippett
Behaviour
The Orange Wisp is inconspicuous due to its minute size and habit of sitting low down among grass stems above the water. They do not fly far once disturbed and quickly settle again on a grass stem. The females occur alongside the males.
The Orange Wisp is active from November to May (see Phenology below).
Orange WispAgriocnemis ruberrima ruberrima – Male Kosi Bay, iSimangaliso Wetland Park, KwaZulu-Natal Photo By Ryan Tippett
Status and Conservation
The South African ruberrima subspecies is uncommon and, due to its small, restricted distribution, is listed as Endangered on the Red List. The Orange Wisp is intolerant of habitat degradation and is only found in pristine habitat. A large amount of its range is currently protected within the iSimangaliso Wetland Park.
Orange WispAgriocnemis ruberrima ruberrima – Male Kosi Bay, iSimangaliso Wetland Park, KwaZulu-Natal Photo By Ryan Tippett
Distribution
The subspecies Agriocnemis ruberrima ruberrima has so far only been recorded from the coastal plain of north-eastern KwaZulu-Natal in South Africa. It could also occur marginally in neighbouring southern Mozambique.
Agriocnemis ruberimma albifrons occurs in the Okavango region of northern Botswana and in the Caprivi strip of Namibia. It is also found in northern Zambia and at a few scattered locations in Angola.
Orange WispAgriocnemis ruberrima ruberrima – Male Kosi Bay, iSimangaliso Wetland Park, KwaZulu-Natal Photo By Ryan Tippett
Below is a map showing the distribution of records for Orange Wisp Agriocnemis ruberrima ruberrima in the OdonataMAP database as at February 2020.
Below is a map showing the distribution of records for Orange Wisp Agriocnemis ruberrima ruberrima in the OdonataMAP database as of December 2024.
The next map below is an imputed map, produced by an interpolation algorithm, which attempts to generate a full distribution map from the partial information in the map above. This map will be improved by the submission of records to the OdonataMAP section of the Virtual Museum.
Ultimately, we will produce a series of maps for all the odonata species in the region. The current algorithm is a new algorithm. The objective is mainly to produce “smoothed” maps that could go into a field guide for odonata. This basic version of the algorithm (as mapped above) does not make use of “explanatory variables” (e.g. altitude, terrain roughness, presence of freshwater — we will be producing maps that take these variables into account soon). Currently, it only makes use of the OdonataMAP records for the species being mapped, as well as all the other records of all other species. The basic maps are “optimistic” and will generally show ranges to be larger than what they probably are.
These maps use the data in the OdonataMAP section of the Virtual Museum, and also the database assembled by the previous JRS funded project, which was led by Professor Michael Samways and Dr KD Dijkstra.
Phenology
Orange WispAgriocnemis ruberrima ruberrima – Male Kosi Bay, iSimangaliso Wetland Park, KwaZulu-Natal Photo By Ryan Tippett
Further Resources
The use of photographs by Diana Russell is acknowledged. Other photographs by Ryan Tippett.
Other common names: Red-rumped Wisp (Alt. English); Oranjesoetjie (Afrikaans)
Recommended citation format: Loftie-Eaton M; Navarro R; Tippett RM; Underhill L. 2025. Orange Wisp Agriocnemis ruberrima ruberrima. Biodiversity and Development Institute. Available online at https://thebdi.org/2020/03/18/orange-wisp-agriocnemis-ruberrima/
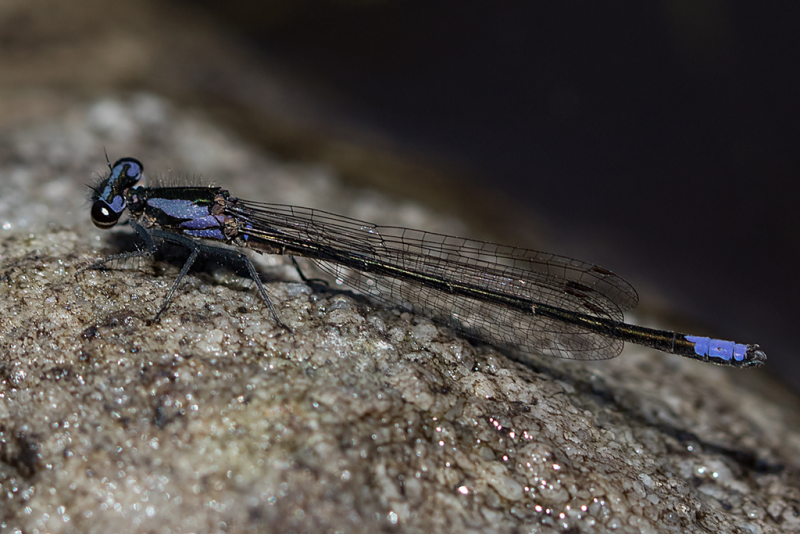
References: Tarboton, M; Tarboton, W. (2019). A Guide to the Dragonflies & Damselflies of South Africa. Struik Nature.
Samways, MJ. (2008). Dragonflies and Damselflies of South Africa. Pensoft
Samways, MJ. (2016). Manual of Freshwater Assessment for South Africa: Dragonfly Biotic Index. Suricata 2. South African National Biodiversity Institute, Pretoria
Martens, A; Suhling, F. (2007). Dragonflies and Damselflies of Namibia. Gamsberg Macmillan.
Find the Painted Sprite in the FBIS database (Freshwater Biodiversity Information System) here.
Family Coenagrionidae
Identification
Painted SpritePseudagrion hageni tropicanum – Male Near Ixopo, KwaZulu-Natal Photo by Ryan Tippett
Smallto Medium sized
Length reaches 46mm; Wingspan attains 58mm.
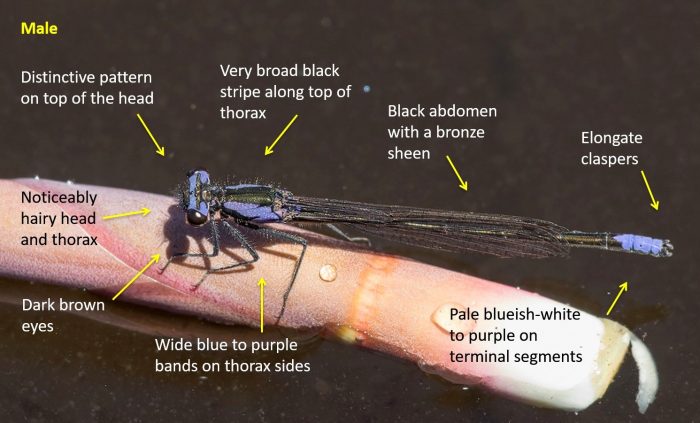
The Painted Sprite has a distinctly elongate appearance. Males are most similar to Pseudagrion newtoni, but are far larger and the blue on the terminal segments does not extend up past segment 8. The two species also occupy very different habitats.
Females are less distinctive but can be recognised by their elongated appearance and shaded habitat.
There are two distinct sub-species in South Africa. Race tropicanum has bright yellow-green thorax sides and antehumeral stripes. Race hageni has bright orange thorax sides and antehumeral stripes.
Click here and here for more details on identification.
Painted SpritePseudagrion hageni tropicanum – Female Kosi Bay, iSimangaliso Wetland Park, KwaZulu-Natal Photo by Ryan Tippett
Habitat
The Painted Sprite is a shade-loving species. It inhabits slow-flowing parts of forested or densely wooded streams and rivers, often with a jumbled undergrowth of tall grasses, bushes, sticks, and ferns, etc. They are frequently found where the tree canopy is closed over. However, the Painted Sprite also occurs at glades and clearings within this habitat, but never far from shade. Pseudagrion hageni also inhabits in dark swamp forests along the KwaZulu-Natal coast.
The Painted Sprite requires clean water and is often found in places where the water is dark and tannin-stained. Painted sprites are intolerant of turbid, muddy water.
Habitat – Kosi Bay, KwaZulu-Natal Photo by Ryan Tippett
Behaviour
The Painted Sprite is almost always found in deep shade areas where males perch on plant stems over the water. The males are conspicuous due to their bright colouration. The females can be found in the same area as the males but often perch higher up and further away from the water. Individuals frequently hover for a few seconds close to the water before alighting on a perch.
The Painted Sprite is most active from October to April but has been recorded year round at a number of sites (See Phenology below).
Painted SpritePseudagrion hageni tropicanum – Male Kosi Bay, iSimangaliso Wetland Park, KwaZulu-Natal Photo by Ryan Tippett
Status and Conservation
Pseudagrion hageni is a common but localised species. It is listed as of Least Concern in the IUCN Red list of Threatened Species. The Painted Sprite is moderately sensitive to habitat disturbance. It can be found in suitable man-made habitats and in areas with some alien plants.
Painted SpritePseudagrion hageni tropicanum – Male Sodwana, iSimangaliso Wetland Park, KwaZulu-Natal Photo by Ryan Tippett
Distribution
Painted Sprites are found from the Western Cape in South Africa to Kenya, Uganda, the Democratic Republic of the Congo, and Angola. In South Africa, the Painted Sprite is widespread in the north, east and south of the Country.
Painted SpritePseudagrion hageni tropicanum – Male Sodwana, iSimangaliso Wetland Park, KwaZulu-Natal Photo by Ryan Tippett
Below is a map showing the distribution of records for Painted Sprite in South Africa. Taken from the OdonataMAP database as at February 2020.
Below is a map showing the distribution of records for Painted Sprite in South Africa. Taken from the OdonataMAP database as of December 2024.
The next map below is an imputed map, produced by an interpolation algorithm, which attempts to generate a full distribution map from the partial information in the map above. This map will be improved by the submission of records to the OdonataMAP section of the Virtual Museum.
Ultimately, we will produce a series of maps for all the odonata species in the region. The current algorithm is a new algorithm. The objective is mainly to produce “smoothed” maps that could go into a field guide for odonata. This basic version of the algorithm (as mapped above) does not make use of “explanatory variables” (e.g. altitude, terrain roughness, presence of freshwater — we will be producing maps that take these variables into account soon). Currently, it only makes use of the OdonataMAP records for the species being mapped, as well as all the other records of all other species. The basic maps are “optimistic” and will generally show ranges to be larger than what they probably are. These maps use the data in the OdonataMAP section of the Virtual Museum, and also the database assembled by the previous JRS funded project, which was led by Professor Michael Samways and Dr KD Dijkstra.
Painted SpritePseudagrion hageni tropicanum – Male Sodwana, iSimangaliso Wetland Park, KwaZulu-Natal Photo by Ryan Tippett
Phenology
Painted SpritePseudagrion hageni tropicanum – Male Kosi Bay, iSimangaliso Wetland Park, KwaZulu-Natal Photo by Ryan Tippett
Further Resources
The use of photographs by Ilse Hulme is acknowledged. Other photographs by Ryan Tippett.
Painted SpritePseudagrion hageniKarsch, 1893
Other common names: Blanketselgesie (Afrikaans).
Recommended citation format: Loftie-Eaton M; Navarro R; Tippett RM; Underhill L. 2025. Painted Sprite Pseudagrion hageni. Biodiversity and Development Institute. Available online at https://thebdi.org/2020/03/09/painted-sprite-pseudagrion-hageni/
References: Tarboton, M; Tarboton, W. (2019). A Guide to the Dragonflies & Damselflies of South Africa. Struik Nature.
Samways, MJ. (2008). Dragonflies and Damselflies of South Africa. Pensoft
Samways, MJ. (2016). Manual of Freshwater Assessment for South Africa: Dragonfly Biotic Index. Suricata 2. South African National Biodiversity Institute, Pretoria
Martens, A; Suhling, F. (2007). Dragonflies and Damselflies of Namibia. Gamsberg Macmillan.
Painted SpritePseudagrion hageni tropicanum – Male Sodwana, iSimangaliso Wetland Park, KwaZulu-Natal Photo by Ryan Tippett
Find the Sapphire Bluet in the FBIS database (Freshwater Biodiversity Information System) here.
Family Coenagrionidae
Identification
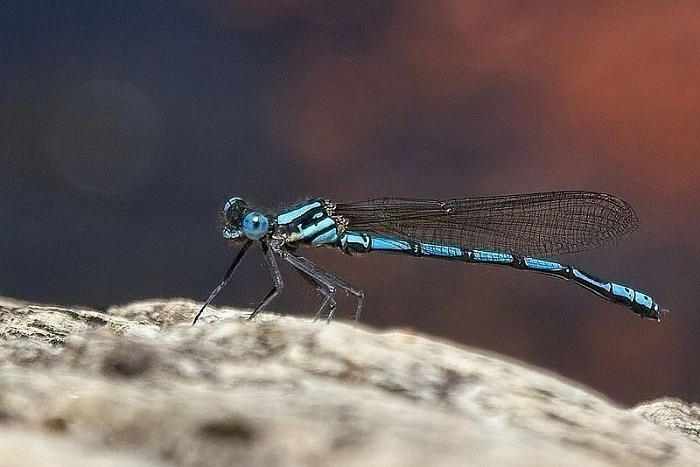
Sapphire BluetAfricallagma sapphirinum – Male Near Kokstad, KwaZulu-Natal Photo by Alan Manson
Very small
Length up to 28mm; Wingspan reaches 40mm.
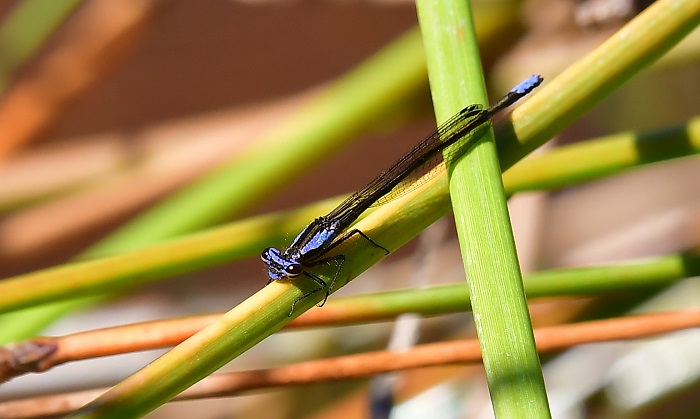
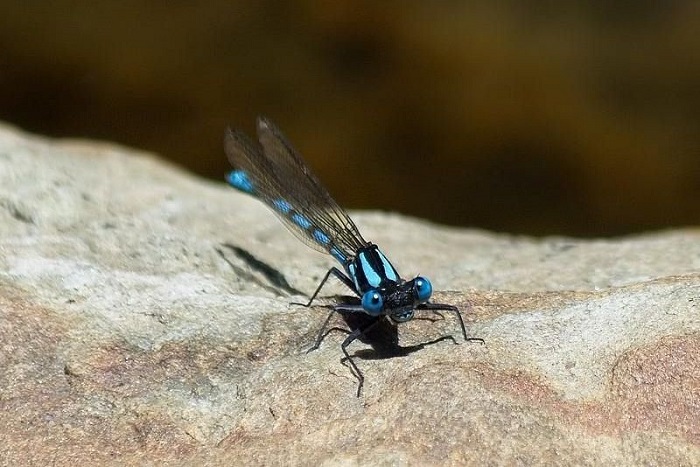
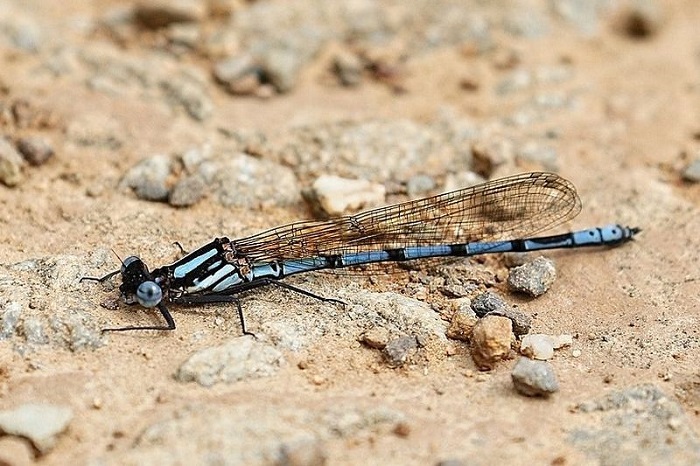
The male Sapphire Bluet carries bright blue and black colouration and is therefore similar to other Bluet species. However, it is easily recognised by its more vivid blue colouration, and by the diagnostic, broad black bands on the abdomen.
Females are distinctive and share the same markings as the males, but are far duller in appearance.
Sapphire BluetAfricallagma sapphirinum – Male Near Colesburg, Northern Cape Photo by Ryan Tippett
Habitat
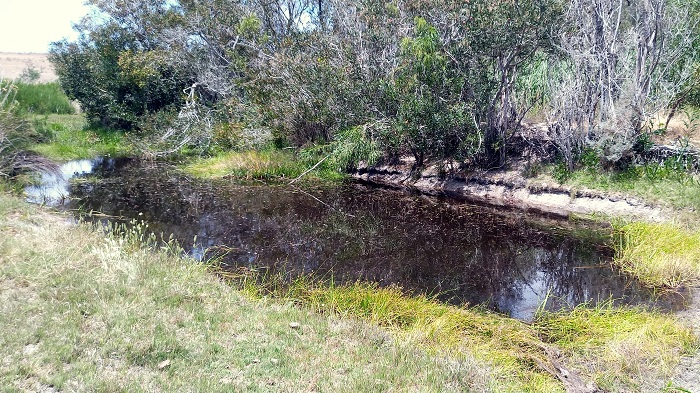
Typical habitat – Wakkerstroom, Mpumalanga Photo by Ryan Tippett
The Sapphire Bluet is found in highveld grassland, where it prefers well-vegetated, still-water habitats. It favours water bodies with floating and half-submerged aquatic plants such as natural ponds, and the sheltered margins of lakes and dams. The Sapphire Bluet is sometimes also found along streams with thick, grassy banks and quiet pools. It mostly occurs at altitudes between 1000 and 1800m above sea level.
The Sapphire Bluet sometimes inhabits well-vegetated, small streams with pools. Near Colesberg, Northern Cape Photo by Ryan Tippett
Behaviour
The Sapphire Bluet sits close to the water on overhanging grass or on floating vegetation. It is an alert and weary species that flies low across the water when disturbed. It hunts from a perch and feeds on small flying insects.
The Sapphire Bluet is on the wing from September to April (see Phenology below).
Sapphire BluetAfricallagma sapphirinum – Male Near Colesburg, Northern Cape Photo by Ryan Tippett
Status and Conservation
Africallagma sapphirinum is a common but localised species. It is listed as of Least concern on the IUCN Red List of Threatened Species. The Sapphire Bluet is moderately sensitive to habitat disturbance. It commonly occurs at suitable man-made dams and ponds, including those with some alien plant growth. Within its habitat range, this species has no doubt benefited from its use of artificial impoundments.
Sapphire BluetAfricallagma sapphirinum – Male Near Colesburg, Northern Cape Photo by Ryan Tippett
Distribution
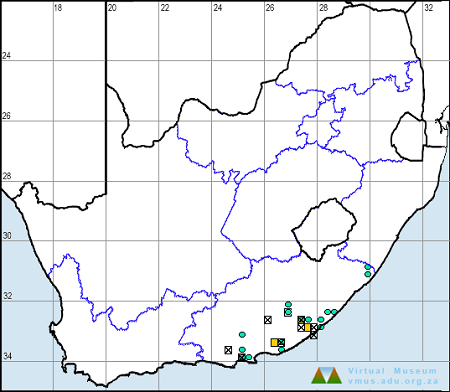
The Sapphire Bluet is endemic to the highveld grasslands of South Africa. There is also an isolated population in the Cedarberg, Western Cape.
Below is a map showing the distribution of records for Sapphire Bluet in the OdonataMAP database as at February 2020.
Below is a map showing the distribution of records for Sapphire Bluet in the OdonataMAP database as at December 2024.
The next map below is an imputed map, produced by an interpolation algorithm, which attempts to generate a full distribution map from the partial information in the map above. This map will be improved by the submission of records to the OdonataMAP section of the Virtual Museum.
Ultimately, we will produce a series of maps for all the odonata species in the region. The current algorithm is a new algorithm. The objective is mainly to produce “smoothed” maps that could go into a field guide for odonata. This basic version of the algorithm (as mapped above) does not make use of “explanatory variables” (e.g. altitude, terrain roughness, presence of freshwater — we will be producing maps that take these variables into account soon). Currently, it only makes use of the OdonataMAP records for the species being mapped, as well as all the other records of all other species. The basic maps are “optimistic” and will generally show ranges to be larger than what they probably are.
These maps use the data in the OdonataMAP section of the Virtual Museum, and also the database assembled by the previous JRS funded project, which was led by Professor Michael Samways and Dr KD Dijkstra.
Phenology
Further Resources
The use of photographs by Alan Manson and Wil Leurs is acknowledged.
Recommended citation format: Loftie-Eaton M; Navarro R; Tippett RM; Underhill L. 2025. Sapphire Bluet Africallagma sapphirinum. Biodiversity and Development Institute. Available online at https://thebdi.org/2020/03/09/sapphire-bluet-africallagma-sapphirinum/
References: Tarboton, M; Tarboton, W. (2019). A Guide to the Dragonflies & Damselflies of South Africa. Struik Nature.
Samways, MJ. (2008). Dragonflies and Damselflies of South Africa. Pensoft
Samways, MJ. (2016). Manual of Freshwater Assessment for South Africa: Dragonfly Biotic Index.Suricata 2. South African National Biodiversity Institute, Pretoria
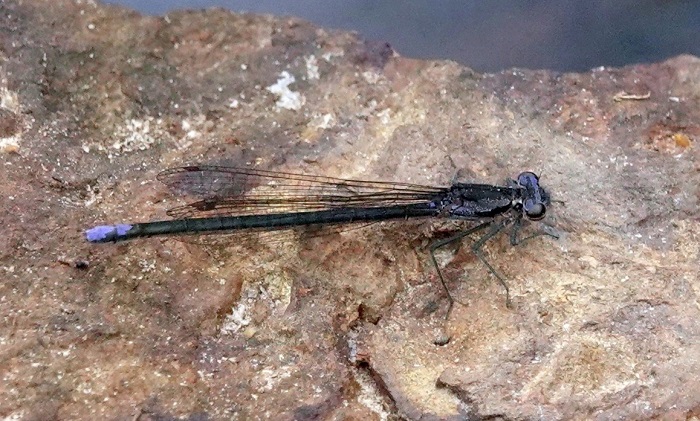
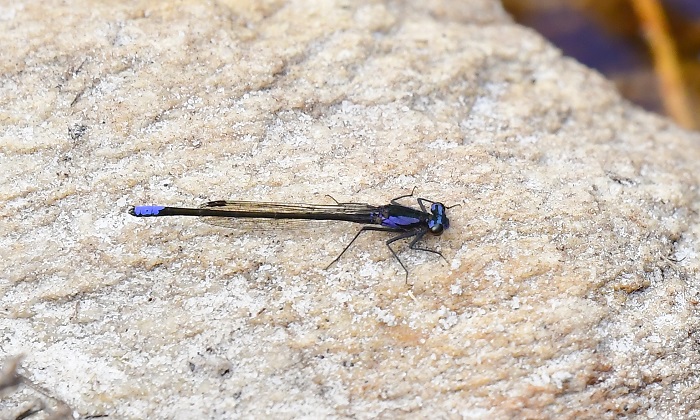
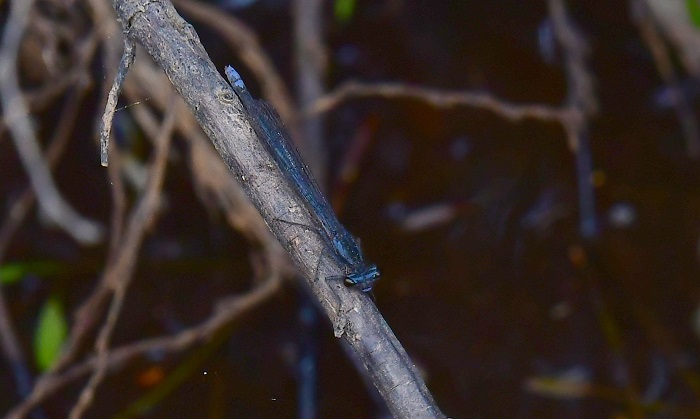
Males are characterised by their largely red head and thorax, including red postocular spots. The lower thorax is pale pruinose blue, while the dark abdomen ends with a bright blue terminal segment.
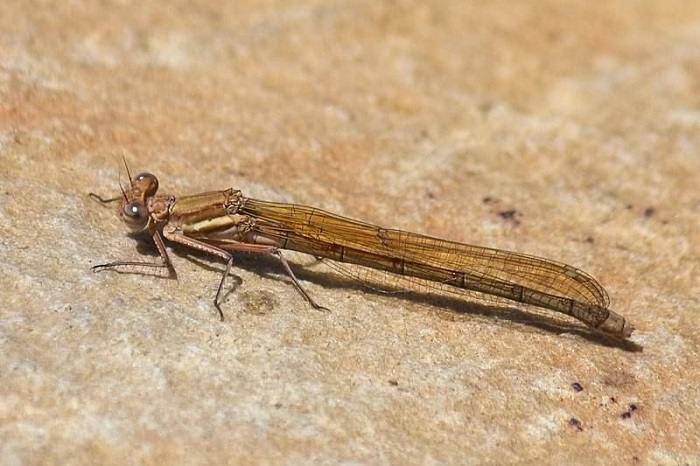
Females are drab brown and best recognised by their association with the males.
Masai SpritePseudagrion massaicum – Female Selinda, Botswana Photo by Ryan Tippett
Habitat
The Masai Sprite is found mostly at still-water habitats such as pans, dams, ponds, lakes and slow flowing parts of rivers and streams. Masai Sprites prefer well vegetated parts of water bodies, however they can also be found at water with bare gravelly or sandy banks provided there is at least some aquatic vegetation.
Habitat – Mkhuze Game Reserve, KwaZulu-Natal Photo by Ryan Tippett
Behaviour
The Masai Sprite perches on waterlilies and other emergent plants and twigs close to the water surface. It sometimes also sits on rocks or exposed sand at the waters edge. Flies low over the water when disturbed, hunting or changing perches. Females can be found near the males, but are frequently found away from the water in the surrounding bushes or woodlands.
The Masai Sprite has been recorded throughout the year at some sites, but is most active from September to April. See Phenology below.
Masai SpritePseudagrion massaicum – Male Carnarvon district, Northern Cape Photo by Ryan Tippett
Conservation and Status
The Masai Sprite is listed as of Least Concern in the IUCN Red List of Threatened Species. Pseudagrion massaicum is an abundant and widespread species that has widely benefited from the use of man-made impoundments. It can be found in somewhat degraded habitats, including sewage treatment ponds and areas with alien plants.
Masai SpritePseudagrion massaicum – Mating pairs Muzi Pan, KwaZulu-Natal Photo by Ryan Tippett
Distribution
The Masai Sprite is widespread across sub-Saharan Africa. It has been recorded from all provinces in South Africa and is likely to occur almost anywhere but is less numerous in arid regions.
Below is a map showing the distribution of records for Masai Sprite in the OdonataMAP database as at February 2020.
Below is a map showing the distribution of records for Masai Sprite in the OdonataMAP database as of December 2024.
The next map below is an imputed map, produced by an interpolation algorithm, which attempts to generate a full distribution map from the partial information in the map above. This map will be improved by the submission of records to the OdonataMAP section of the Virtual Museum.
Ultimately, we will produce a series of maps for all the odonata species in the region. The current algorithm is a new algorithm. The objective is mainly to produce “smoothed” maps that could go into a field guide for odonata. This basic version of the algorithm (as mapped above) does not make use of “explanatory variables” (e.g. altitude, terrain roughness, presence of freshwater — we will be producing maps that take these variables into account soon). Currently, it only makes use of the OdonataMAP records for the species being mapped, as well as all the other records of all other species. The basic maps are “optimistic” and will generally show ranges to be larger than what they probably are.
These maps use the data in the OdonataMAP section of the Virtual Museum, and also the database assembled by the previous JRS funded project, which was led by Professor Michael Samways and Dr KD Dijkstra.
Phenology
Masai SpritePseudagrion massaicum – Male Montagu, Western Cape Photo by Ryan Tippett
Further Resources
The use of photographs by Basil Boer is acknowledged. All other photographs by Ryan Tippett.
Masai SpritePseudagrion massaicumSjöstedt, 1909
Other common names: Masaigesie (Afrikaans)
Recommended citation format: Loftie-Eaton M; Navarro R; Tippett RM; Underhill L. 2025. Masai Sprite Pseudagrion massaicum. Biodiversity and Development Institute. Available online at https://thebdi.org/2020/03/04/masai-sprite-pseudagrion-massaicum/
References: Tarboton, M; Tarboton, W. (2019). A Guide to the Dragonflies & Damselflies of South Africa. Struik Nature.
Samways, MJ. (2008). Dragonflies and Damselflies of South Africa. Pensoft
Samways, MJ. (2016). Manual of Freshwater Assessment for South Africa: Dragonfly Biotic Index. Suricata 2. South African National Biodiversity Institute, Pretoria
Martens, A; Suhling, F. (2007). Dragonflies and Damselflies of Namibia. Gamsberg Macmillan.
Masai SpritePseudagrion massaicum – Male Amakhosi Game Reserve, KwaZulu-Natal Photo by Ryan Tippett