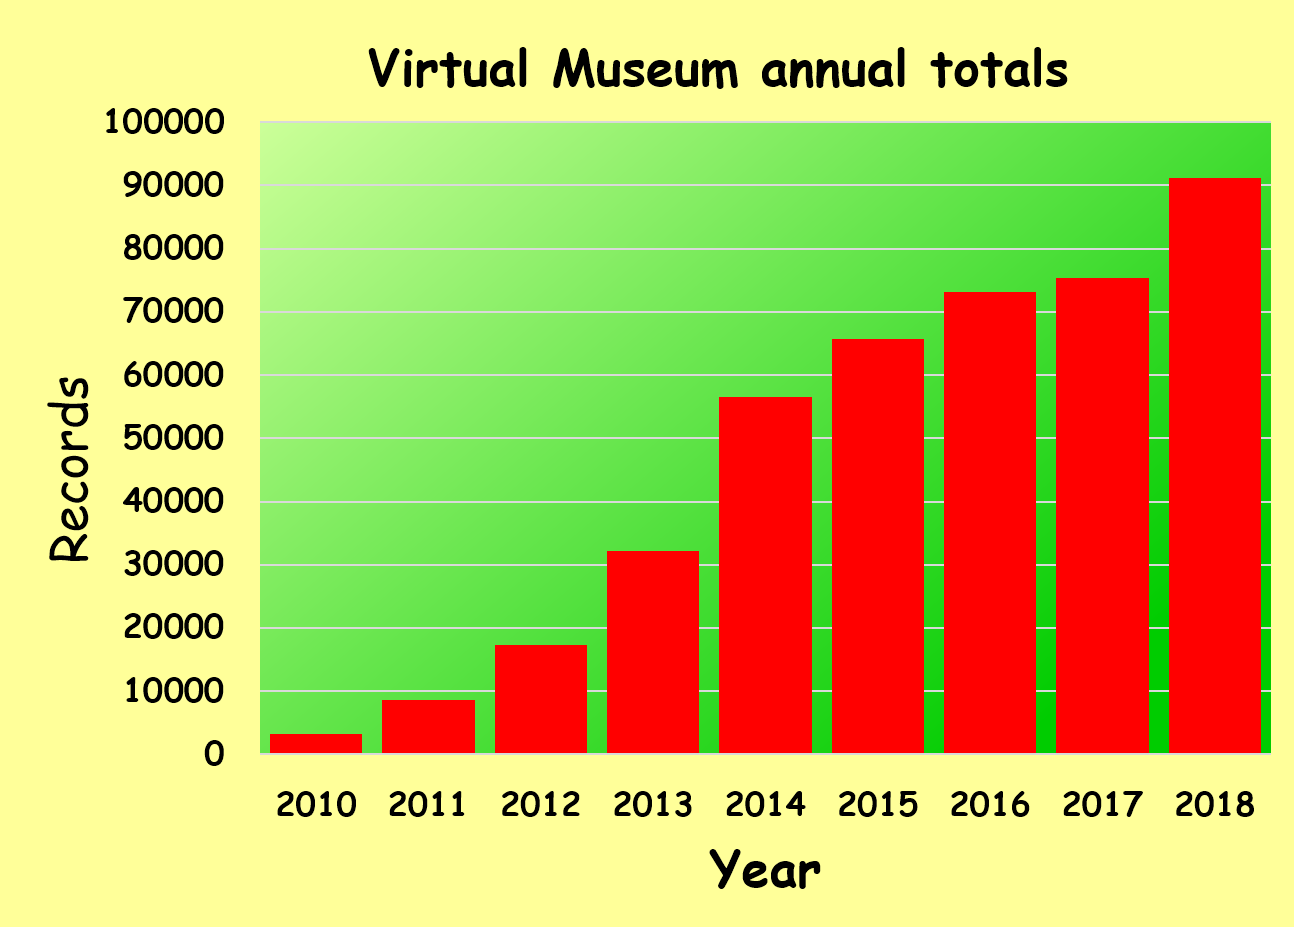
The Virtual Museum had its BestYear ever in 2018, by a margin of 21%. The total for 2018 was 93,482 records. The totals for 2017 and 2016 were 75,408 and 73,104 respectively. That is a massive increase in 2018, conspicuously visible in the bar chart below.
Annual numbers of records submitted to the Virtual Museum.
In theory, it is easy to count. Subtract the counter for the number of records submitted to the Virtual Museum at the end of a year from the counter at the end of the following year. This is pretty close, but it does not give quite the right answer. This is because sometimes the photograph(s) for a record contain more than one species, and the record needs to be duplicated. Sometimes there are duplicate records which need to be removed. The table below gives the correct number of records in each section of the Virtual Museum which were uploaded during 2018, as at 5 January 2019. For the first time, this total exceeds 90,000 records! By a large margin.
Numbers of records for each section of the Virtual Museum in 2018. The total excludes VultureMAP, which is included within BirdPix.
From the table above, three sections of the Virtual Museum received more than 10,000 records: LepiMAP got 29,077, OdonataMAP 21,373 and BirdPix 19,525. Another eight got more than a 1,000.
The logo for LacewingMAP
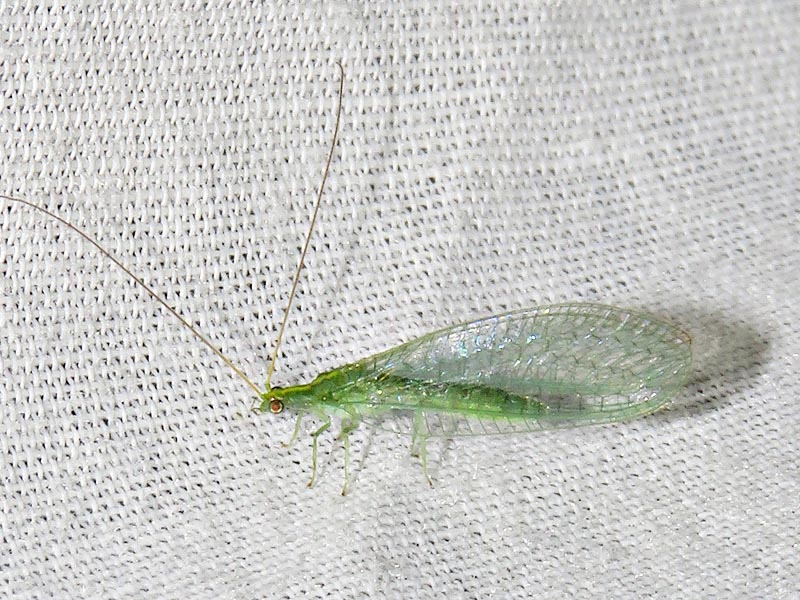
But poor old LacewingMAP only got 678 records! And 2018 was its BestYear. Before you dismiss this as irrelevant, you need to grasp the context! Mervyn Mansell, who does the identifications for LacewingMAP, is ecstatic about this number. One of the things he achieved during his career as entomologist was to assemble a database containing the details of almost every specimen of a lacewing, collected in Africa, and curated in a museum anywhere in the world. That entire database contains 12,898 records, collected since 1900. (Gosh, that is only 44% of the number submitted to LepiMAP last year.) So the 678 records of 2018 added 5.3% to the specimen database. That is huge. The best decade of specimen collecting of lacewings for museums was in the 1980s, when on average 345 per year were collected. The 2018 total of 678 is almost double that. This is amazing. Proportionately, LacewingMAP is one of the best performing sections of the Virtual Museum. Now you can understand why Mervyn Mansell is so enthusiastic about the contributions made by citizen scientists to LacewingMAP. You catch this enthusiasm from the tone of his comments in the caption to the photo below!
This was one of the last lacewings to be uploaded to the Virtual Museum during 2018. The photo was taken on 31 December by Nigel Gericke and it was submitted that same evening to LacewingMAP by Sue Gie. It is on a farm in the Karoo near Montagu. Mervyn Mansell comments: “This species, Nemeura gracilis, is a Cape endemic, largely confined to the Western Cape, but also with a few records from the Eastern Cape. It is largely confined to mountainous areas, and is readily attracted to light. It has been recorded fairly close to Cape Town. Nothing is known about its biology. This family of lacewings (Nemopteridae) is well represented in the south western parts of South Africa, but very few species occur beyond the Eastern, Western and Northern Cape Provinces, where more than 65% of the world’s known species occur.” Wow! It is also the first record ever of a lacewing from quarter degree grid cell 3320CB, including a search of the specimen database! There are 52 records of Nemeura gracilis in the LacewingMAP database (i.e. 52 records in the world): 46 of them are specimen records, and this is the sixth photographic record in LacewingMAP. This record is curated at http://vmus.adu.org.za/?vm=LacewingMAP-15681.
Similar stories can be written about many of the sections of the Virtual Museum, including many of the ones with relative small numbers of records submitted annually. and we will explore them in future blog posts. Citizen scientists are making a decisive contribution to understanding the current distributions of species, and how these are changing. This is critical information for all conservation initiatives.
This is the first of several blog posts about the Virtual Museum in 2018. We have, for example, asked members of the Expert Panels who do the identifications to tell us some of the records which impressed them the most in 2018. That is on its way. Enjoy.
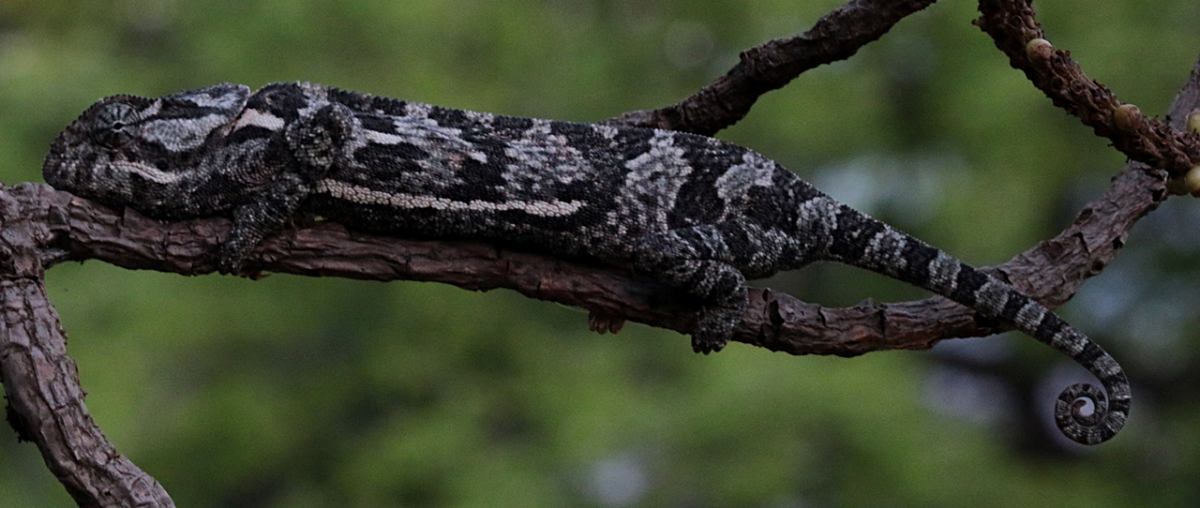
For many years, I could find a Cape Dwarf Chameleon almost on demand in my garden in Rondebosch. If a visitor wanted to see one, it was seldom more than a few minutes search to find one. They had several favourite spots, which was where I looked first. One of these was a bottlebrush bush which was growing a few metres from the kitchen window. Given that the bottlebrush is an alien plant species, it is a unexpected that generations of chameleons would select the sane plant. But obviously, the bottlebrush must had attracted a good supply of insects, as chameleon food. So close-up views of chameleons during breakfast and washing up dishes was part of normal everyday life. This blog attempts to use the data in the ReptileMAP section of the Virtual Museum to describe how Cape Dwarf Chameleons went from common to locally extinct in the garden.
The Cape Dwarf Chameleon occurs in only 16 quarter degree grid cells at the southwestern tip of Africa. There is a total of 221 records in the Virtual Museum.
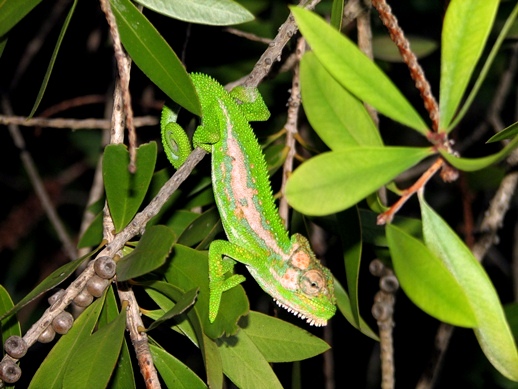
It seems that my first digital image of a Cape Dwarf Chameleon was an attempt to frustrate audiences. It was taken on 27 August 2006. It was regularly used in PowerPoint presentations, especially as the slide before the title, with the instruction, find the reptile on the screen. Now you need to find it on your screen!
Here is a zoomed in version, in which it is easy to see the chameleon, but you still need to find where this is in the photo above.
Now you can see the chameleon easily, but find where this fits into the photo above is still a bit of a challenge.
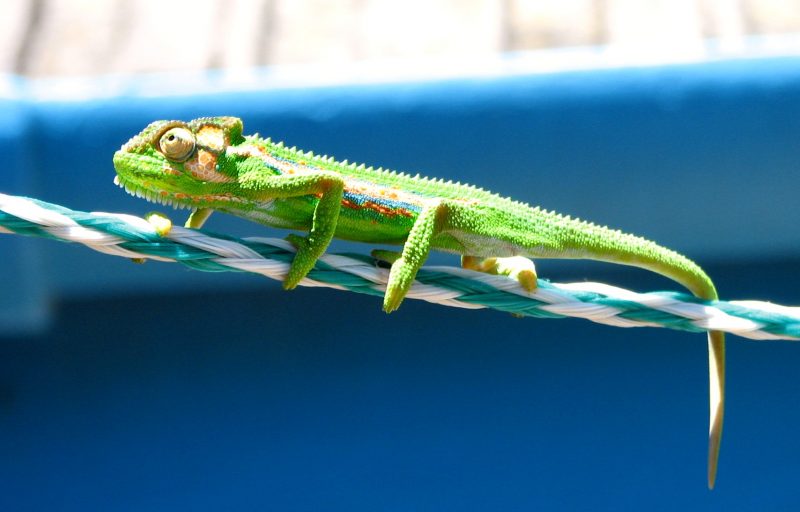
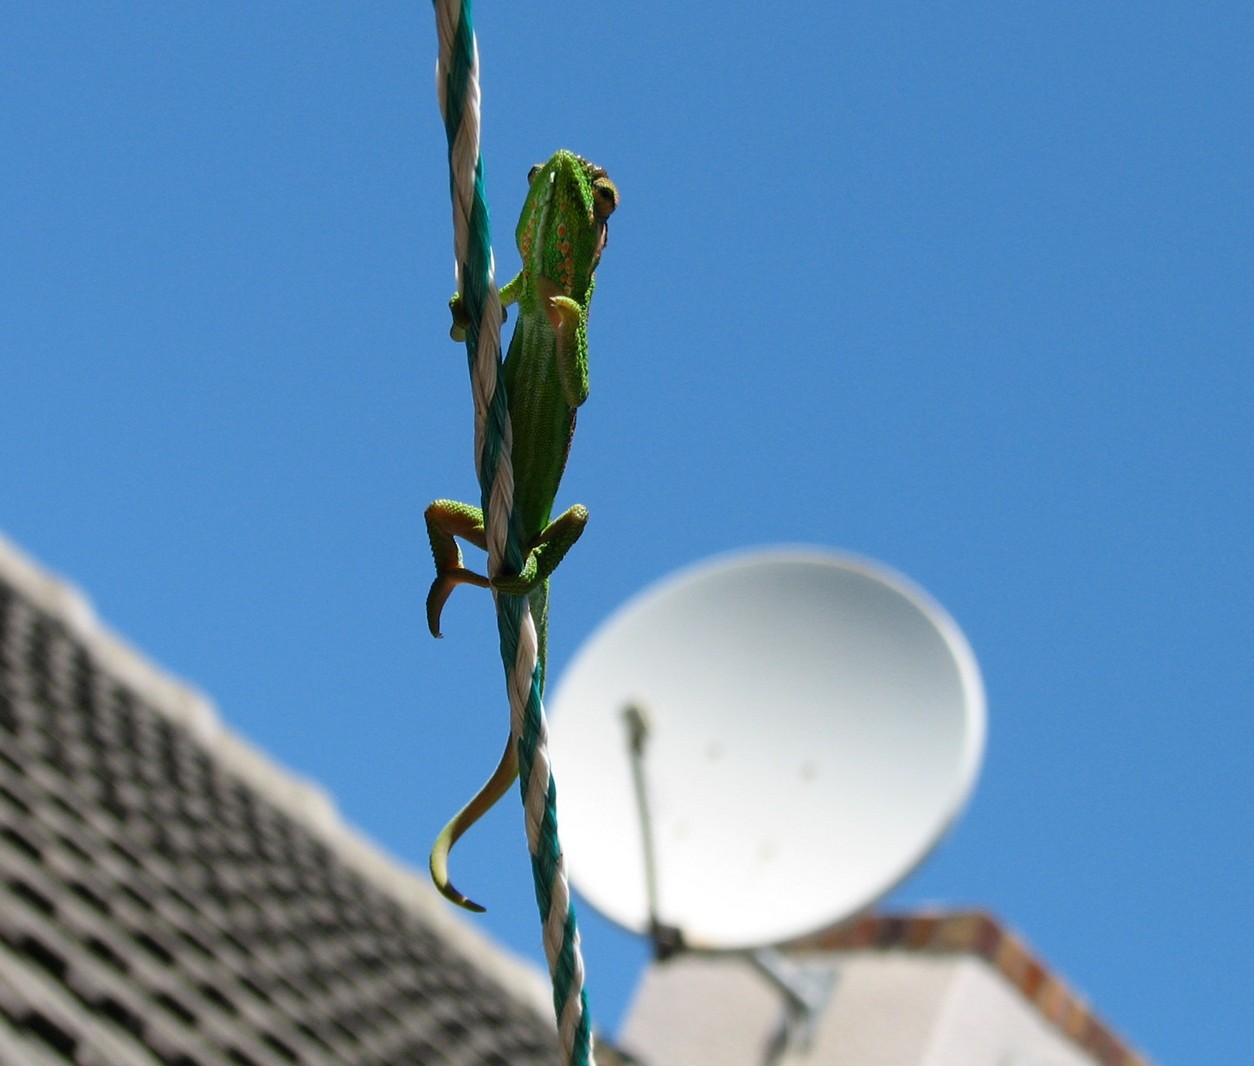
It next time I took a digital image of a chameleon was a few months later, on 25 November 2006. It was doing the totally daft thing of doing a tightrope walk along the washing line.
This is the first of many records of successive generations of Cape Dwarf Chameleons which used this bottlebrush bush. Curated at http://vmus.adu.org.za/?vm=ReptileMAP-7406.
It seems that I took no photos of chameleons from 2006 to 2012, because there are none uploaded to ReptileMAP. There were simply chameleons almost continuously in the garden. At the time, it seemed pointless recording them. The photos that I got were used to illustrate camouflage and to document the tightrope stunt!
A sobering event took place near the end of 2012. My PhD student, Elsa Bussiere, was distracted by a continuous clicking sound that was persisting for hours and hours. Investigating, she found that a chameleon was short-circuiting two of the wires of an electric fence which had recently been erected by a neighbour. The chameleon was dead.
After this, I started uploading the bottlebrush chameleons regularly, until I was doing this every time I saw them. There are five records in 2013. six in 2014, three in 2015, and two in 2016, on 28 September, and on 31 October. And those two records in 2016 were the last two records of Cape Dwarf Chameleon in my garden. This is now more than two years ago, more than double the largest gap in any previous pair of records
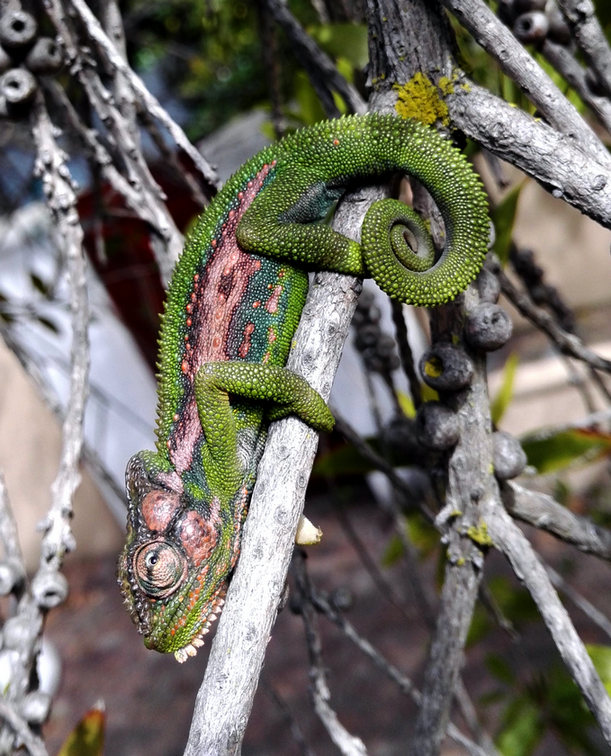
This beautifully marked Cape Dwarf Chameleon was recorded in the bottlebrush. Sadly, this was more than two years ago, and the species now seems to be locally extinct. This photo was taken by Andreas Ionnides, and uploaded to the Virtual Museum as http://vmus.adu.org.za/?vm=ReptileMAP-159467.
It seems likely that the Cape Dwarf Chameleon is now extinct in my garden, and this is probably true of the neighbourhood. The proliferation of electric fences took place at during the period the chameleon disappeared, and this is almost certainly a key factor.
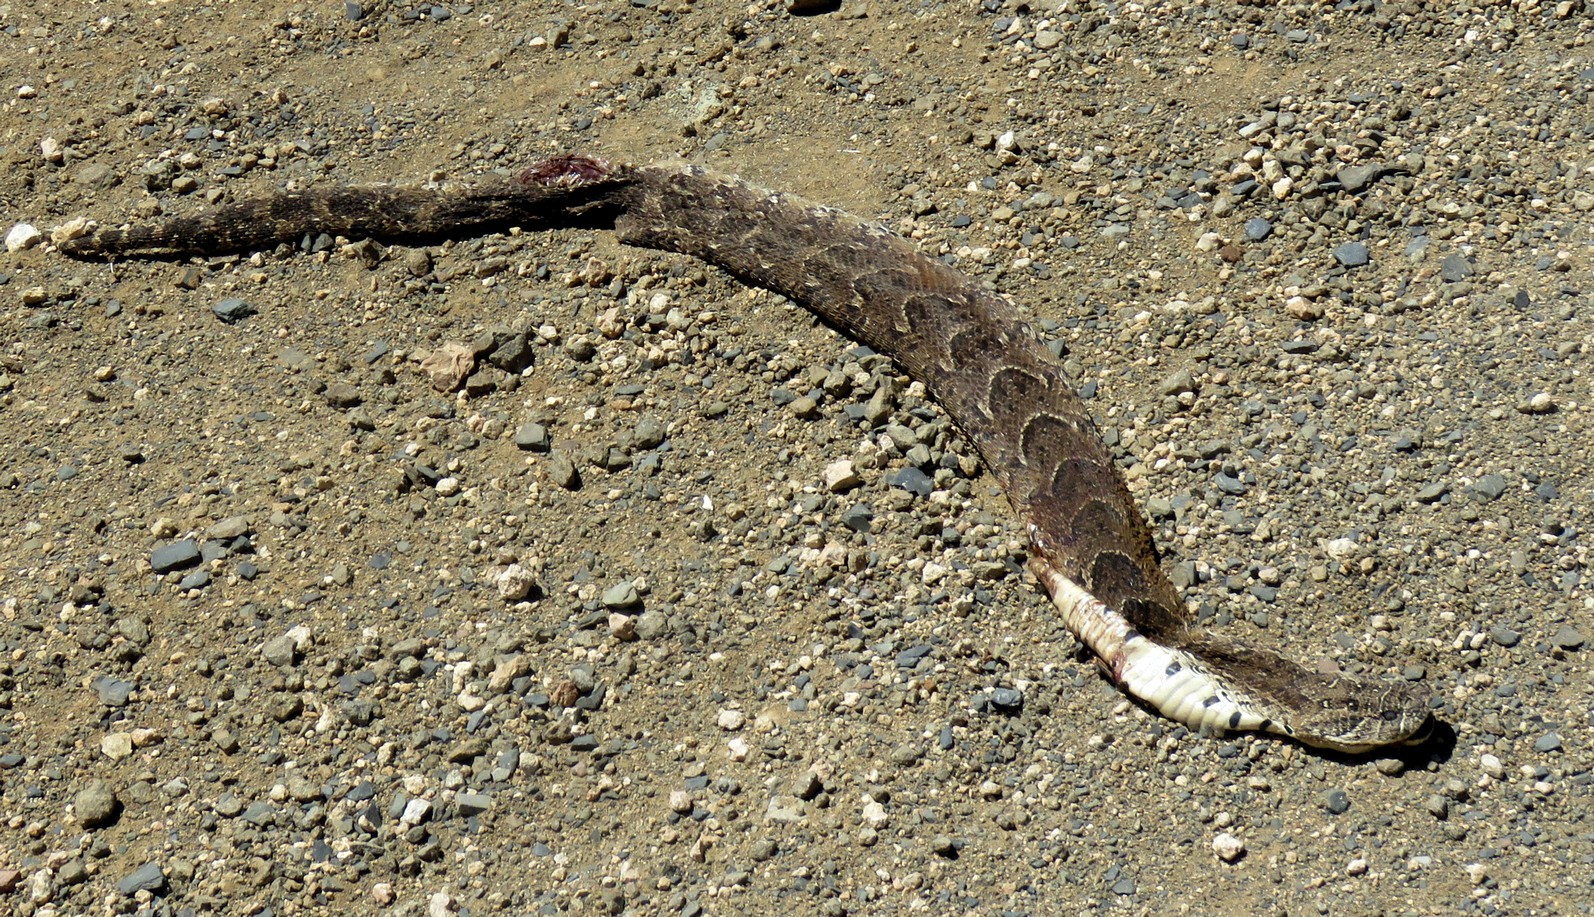
Another factor is getting flattened on roads.
A big wheel has flattened this three-dimensional chameleon into a two-dimensional chameleon. Roads take a large toll on biodiversity. Most visibly it is reptiles (and especially snakes), birds and mammals that become road kills. This incident was documented by Bukola Braimoh and Joshua Azaki in Observatory on 24 December 2017. It is never pleasant to take photographs like these, but they incredibly important and valuable as evidence of cause of death. This record is curated at http://vmus.adu.org.za/?vm=ReptileMAP-164297.
From 2012 onwards, data collection can almost be described as consistent, but it is certainly not good enough for a scientific paper. The weakest part of this account is the lack of solid evidence that Cape Dwarf Chameleons really were common in the garden until about 2012. We do not know what species is next going to be impacted. So the best advice to give citizen scientists is to set themselves the target of “refreshing” the occurrence of even the common species in their patches at regular intervals. Quarterly feels about right, but there are no hard and fast rules as yet.
Keep your favourite camera handy! Grab all the opportunities which present themselves to take photos for the Virtual Museum.
My camera was on my lap when I drove past this holiday house in Bettys Bay. This baboon was on the roof, snacking the red lentils it had found inside. This observation is curated at http://vmus.adu.org.za/?vm=MammalMAP-26870
Don’t be shy to post a bad picture to the Virtual Museum. As long as we can work out what species it is, it counts as a record.
Don’t hesitate to post a picture of something which you don’t know what it is called – that’s why we have experts helping us.
Embrace the reality that contributing to the Virtual Museum is not only for serious photographers or scientifically-minded people, but for the ordinary everyday person too. Everyone can play an important role in citizen science projects.
Remember that even your backyard and the places where you work contain interesting records. So do shopping malls and airports.
This Speckled Pigeon was inside the departure lounge at Addis Ababa airport. This cell phone photo became record 46416 in BirdPix! (http://vmus.adu.org.za/?vm=BirdPix-46416)
Grab the opportunities that travel offers, whether you are going on holiday or on business.
If you think of yourself as only an occasional photographer, post the handful of photos which you have. They are important records and may fill serious gaps in distribution maps, in developing our knowledge of where species are found.
Hope that you discover a new species.
This is a probably a new species of lacewing in the family Mantispidae! Zenobia van Dyk took the photo near Clanwilliam and uploaded it to LacewingMAP. Mervyn Mansell, who does the IDs, commented: “This is probably an undescribed species, so it is not possible it identify it further at this stage. Mantispids have a unique biology in that the larvae are parasitic on spider’s egg sacs where they feed on eggs and spiderlings. The eggs, laid in large batches, hatch into a triungulin larvae that seeks out a spider and is carried back to the nest. Once in the nest, the larva undergoes a hypermetamorphosis and cannot move elsewhere. Pupation takes place in a silken cocoon in the nest. Mantispidae are fairly rare in the Western Cape.” Wow. See http://vmus.adu.org.za/?vm=LacewingMAP-15500.
Make citizen science an activity for the whole family, young and old. Each member, with their varying interests, can be involved. And fun too. Take pictures on your hikes, picnics, a stroll on the beach. Everywhere you go, look carefully, there are important nuggets of information which can be submitted to citizen science projects.
Introduce someone to citizen science, by taking them with you, and showing them how easy it is to become a citizen scientist and to make a real contribution to biodiversity conservation. Recruit them and coach them into becoming active particpants in the Virtual Museum.
Become an “Ambassador for Biodiversity” – talk to people about citizen science projects and how important they are for understanding the current distributions of species.
Be a BioMAPper! Expand your horizons from being only a LepiMAPper or MammalMAPper or OdonataMAPper!
Think of yourself as a PHunter, a photographic hunter.
Work your way through your old photos, and upload all those that you think are interesting or important records to the Virtual Museum.
John Paterson took this photo of a lion in 1985. He uploaded it to the MammalMAP section of the Virtual Museum in 2018! He writes in the comments section: “Unusual record of lion foraging on a dead whale. To my knowledge only record of this behaviour.” He observed this in the Skeleton Coast Park. This remarkable incident is now recorded for posterity! See http://vmus.adu.org.za/?vm=MammalMAP-26890. The whale is a separate record in MammalMAP: http://vmus.adu.org.za/?vm=MammalMAP-26893. It is a Southern Long-finned Pilot Whale.
Although alien species are widely (and rightly) regarded as a “bad thing”, they offer special opportunities for research! In a nutshell, many of these opportunities can be summarized into two questions: “How has the species adapted to its new environment? What impact is it having on its environment?” There are 10 alien bird species in South Africa.
These 10 bird species are recognised as “feral“, that is, they are aliens which have established self-sustaining breeding populations in South Africa. The “natural” ranges of all these species are in the northern hemisphere, so one research opportunity is the question: “How does the timing of the major events of the annual cycle between the introduced population compare with that of the source population? Are they simply shifted by six months, or is it more complex than that?”
This article provides a list of these 10 alien bird species in South Africa, and describes briefly how they arrived here. It summarizes opportunities for research. Each species is illustrated with a photograph selected from the BirdPix section of the Virtual Museum at http://vmus.adu.org.za. A few have their distributions illustrated by maps produced from the data of the bird atlas project at http://sabap2.adu.org.za.
Mallard Anas platyrhynchos
The small black mark on the top of the bill indicates that these are hybrids between Mallard and Yellow-billed Duck. This photograph was taken by AP Labuschagne at Lamberts Bay, in the northwest corner of the Western Cape. See http://vmus.adu.org.za/?vm=BirdPix-40550 for more detail of this record. This is one of 44 records of Mallards and Mallard-hybrids in the BirdPix section of the Virtual Museum. Some of the hybrids are quite bizarre in appearance; see for example: http://vmus.adu.org.za/?vm=BirdPix-47425
Mallards were not deliberately introduced, but were escapees from private collections of waterfowl. Sightings at wetlands started to be reported in bird club newsletters from around 1980, especially in Gauteng and the Western Cape. It was quickly discovered that they hybridize with the local ducks, and especially the Yellow-billed Duck Anas undulata. This poses a severe threat to the genetic integrity of the populations of indigenous ducks. Initial opposition to culling was largely overcome by good communication campaigns, for example this information brochure produced for Cape Town. Mallards and Mallard-hybrids are nowadays fairly consistently removed by the conservation authorities whenever they are reported. Of the 10 alien bird species in South Africa, the Mallard is one of two which are actively and decisively controlled, and which are therefore not appropriate for observational research projects. The other species is the House Crow Corvus splendens, discussed below.
Chukar Partridge Alectoris chukar
These Chukar Partridges were in the village on Robben Island. See http://vmus.adu.org.za/?vm=BirdPix-2108 for more detail of this record. This is one of 13 records of this species in the BirdPix section of the Virtual Museum. All are from Robben Island.
Six Chukar Partridges were confiscated in 1964 by the customs authorities at the port of Cape Town, and were released on Robben Island, Table Bay. In 2018, the population numbered in the hundreds. The size of the population has fluctuated widely; for example during the “cat-years” of the mid 2000s, the population seemed to have been down to tens of birds. They do not appear to have crossed the 7 km of ocean to reach the mainland. There is potential as a study species, for example, here is a paper in the ejournal Biodiversity Observations with the first effort to estimate the timing of breeding on Robben Island.
Common Peacock Pavo cristatus
This Common Peacock was photographed by Zenobia van Dyk on a farm in the Eastern Cape. From her description, this bird is probably semi-feral. See http://vmus.adu.org.za/?vm=BirdPix-54818. There are 29 records of Common Peacock in the BirdPix section of the Virtual Museum
Like the Mallard, the Common Peacock is an ornamental bird, with domestic populations on many estates and around farm houses. Out in the countryside, it is often hard to classify an individual peacock as “domestic” or “feral”; in reality many are along a continuum between these two extremes, and should be classified as “semi-feral”. The distribution map below shows how widespread peacocks, feral and semi-feral, have become. However, the peacocks on Robben Island are indisputably feral. It is thought to have been introduced there in 1968 and the population has maintained itself. Increasingly, we are grasping that there are more or more feral populations scattered across the whole of South Africa. Here are links to papers in the ejournal Biodiversity Observations which describe feral populations in Bloemfontein, Free State, and Amanzimtoti, KwaZulu-Natal. There are wine farms in the Western Cape, where flocks of peacocks do substantial damage in vineyards. These are potential study sites for this species.
This is the SABAP2 distribution map for the Common Peacock on 23 December 2018. Many of the records would be of semi-feral peacocks, but it is nevertheless remarkable in how many “pentads” peacocks have been recorded by the bird atlas citizen scientists. There is a full description of the methods used by the Second Southern African Bird Atlas Project in this paper The fundamentals of the SABAP2 protocol, and an explanation of the interpretation of this map in a paper entitled Pentad scale distribution maps for bird atlas data.
Rose-ringed Parakeet Psittacula krameri
There are 20 records of Rose-ringed Parakeet in the BirdPix section of the Virtual Museum. Four of these are from the area of Africa in which it occurs naturally: Sudan, Nigeria, Ghana and Senegal. There are 15 photographic records of alien parakeets in South Africa: 11 from Gauteng, four records from KwaZulu-Natal, and one from the Western Cape. These two birds were recorded by Anthony Paton in the Randburg-Roodepoort region of Johannesburg. See http://vmus.adu.org.za/?vm=BirdPix-43335.
The Rose-ringed Parakeet is a popular cage-bird, and escapes from captivity occur regularly. Small breeding populations seem to have been established in the main cities of South Africa multiple times, and then gone extinct. But there are now substantial populations, numbering hundreds, both in the Durban region, and in the suburbs of the cities of Gauteng. This was the study species of a recent BSc(Hons) project (Ivanova IM 2017. Spatial and temporal impacts of the alien species Psittacula krameria on the occurrence of avifauna in Gauteng. Honours thesis, University of the Witwatersrand, Johannesburg). There are opportunities for further research projects. Indeed, Ielyzaveta Ivanova ends her discussion with the statement: “this study highlights the need for more research into the potential impacts of the species.”
Wild Rock Doves in South Africa are derived from escaped domestic birds, a process that would have started in 1652 with the arrival of the first domestic Rock Doves with the Dutch settlers. Wild populations are continually supplemented by escapes from ornamental populations, resulting in a wide variety of colour morphs. Until about 1990 they were confined mainly to the urban and industrial areas of cities, towns and villages. They have subsequently spread into agricultural landscapes; for example, they have largely replaced Speckled Pigeons Columba guinea on dairy farms in the Swartland region of the Western Cape. There are multiple research opportunities.
The bird atlas distribution map for the Rock Dove. The pentads shaded dark blue have the largest reporting rates. The clusters of dark blue pentads are concentrated on the cities of South Africa. Downloaded from the SABAP2 website on 23 December 2018.
House Crow Corvus splendens
There are 15 records of House Crow in the BirdPix section of the Virtual Museum. Most of them are from port cities and towns along the Indian Ocean coast of Africa: from north to south, Lamu, Mombasa, Zanzibar, Dar es Salaam, Beira, Maputo and, finally, … Durban. The late Rob Dickinson, whose photo this is, was a remarkable citizen scientist, and this House Crow, welcoming Rob to Tanzania at Das es Salaam Airport was selected to celebrate his memory. He made contributions to the Virtual Museum from all over Africa. More details of this record are at http://vmus.adu.org.za/?vm=BirdPix-21374.
The House Crow seems to be the only species of the 10 on this list that introduced itself. The ports of East Africa have large populations, and its arrival in the port cities of Durban (around 1970) and Cape Town (early 1990s) is likely to have been of birds that got themselves trapped inside the holds of cargo ships. In both cities there have been massive eradication campaigns. So it is no longer a feasible species to study!
Common Starling Sturnus vulgaris
There are 116 records of Common Starling in the BirdPix section of the Virtual Museum. This is the first and only record from Gauteng, taken by Kevin Lavery on 13 June 2015, near Vereeniging along the Vaal River. Details at http://vmus.adu.org.za/?vm=BirdPix-65734.
18 Common Starlings were released by Cecil John Rhodes in Rondebosch, Cape Town, in 1887, about 130 years ago. The range expansion has been reasonably well documented, but it has not been properly reviewed for many decades. Until about 1910, it was confined to the Greater Cape Town region, and then steadily expanded eastwards and, more slowly, northwards. The range expansion has continued into the 21st century. In the two decades between the first and second bird atlases in southern Africa, it has started occurring extensively in KwaZulu-Natal, Free State, Gauteng and Lesotho. Common Starlings have also been introduced to North America, Australia and New Zealand. There has been quite extensive research on the starling in these regions, but all the studies in southern Africa have been descriptive. There are multiple research opportunities.
Common Myna Acridotheres tristis
This image was selected from the 96 Common Mynas available in the Virtual Museum because it is the only one beyond South Africa’s borders. Samantha Venter took this photo in Gaborone, Botswana. Full details at http://vmus.adu.org.za/?vm=BirdPix-22063.
There were two centres of introduction of Common Mynas to South Africa and different subspecies were involved: the mynas introduced to Durban about 1900 were the subspecies tristoides from Myanmar and adjacent Assam, an Indian state. The mynas introduced to Johannesburg in 1930s were of the nominate subspecies tristis. Of the 10 species considered here, this is the one that is currently expanding its range the fastest. There are multiple resources to describe the range expansion of this species through time, but an authoritative review remains to be written. Apart from some short notes, there are no studies of the biology of Common Mynas in southern Africa. There are multiple research opportunities.
This is the “range-change” map for the Common Myna in South Africa, Lesotho and Eswatini. It shows how the range of the species changed in the quarter century between the two bird atlas projects. There is a full description of the algorithm used to produce this map, and its interpretation, in a paper in the ejournal Biodiversity Observations called Displaying changes in bird distributions between SABAP1 and SABAP2. In summary, the grid cells for which there is enough data to take a decision are shaded in one of six colours: blue, dark green, light green, yellow, orange or red. Blue and red are the extremes; under a set of assumptions, they mean that a three-fold increase/decrease respectively has occurred in the grid cell between the two projects. For the Common Myna there has clearly been a massive increase in abundance since SABAP1. In parts of KwaZulu-Natal, the core of the SABAP1 range, there appears to have been large decreases in abundance. This observation needs confirmation by fieldwork.
House Sparrow Passer domesticus
This male House Sparrow was photographed by John Fincham near the village of Kliprant in the arid Knersvlakte of the Western Cape. See http://vmus.adu.org.za/?vm=BirdPix-18523 There are a total of 212 records of the species in the BirdPix section of the Virtual Museum.
The House Sparrows in South Africa are of the Indian subspecies indicus. It seems likely that some of the labourers transported from India in the 1880s and 1890s to work in the sugar-cane fields brought House Sparrows with them as pets. Those that escaped established the feral population. The history of the range expansion up to about 1950 is poorly documented, but it was still largely confined to KwaZulu-Natal. After that the range expansion was explosive over the remainder of South Africa, Namibia, Botswana, Zimbabwe, Mozambique, Zambia, Malawi, Angola and the Democratic Republic of Congo. The impact of the founder population has been enormous. There is a small number of papers on the biology of this introduced species in South Africa, and the opportunities for further studies are large.
The SABAP2 distribution map for the House Sparrow, 23 December 2018. It is recorded in most places in South Africa where there is human habitation, even in arid regions. For example, in the Kruger National Park in the northeast, the only human habitations are the tourist rest camps, and these are the places with House Sparrows there. There is a full description of the methods used by the Second Southern African Bird Atlas Project (SABAP2) in this paper The fundamentals of the SABAP2 protocol, and an explanation of the interpretation of this map in a paper entitled Pentad scale distribution maps for bird atlas data.
This is the “range-change” map for the House Sparrow in South Africa, Lesotho and Eswatini. It shows how the range of the species changed in the quarter century between the two bird atlas projects. There is a full description of the algorithm used to produce this map, and its interpretation, in a paper in the ejournal Biodiversity Observations called Displaying changes in bird distributions between SABAP1 and SABAP2. In summary, the grid cells for which there is enough data to take a decision are shaded in one of six colours: blue, dark green, light green, yellow, orange or red. Blue and red are the extremes; under a set of assumptions, they mean that a three-fold increase/decrease respectively has occurred in the grid cell between the two projects. For the House Sparrow, in total contrast to the Common Myna, above, there is almost a jumble of colours since SABAP1, with very little patterning. Within this region, there have been no new areas colonized since SABAP1, and at a local scale, there have been fluctuations in population size.
Common Chaffinch Fringilla coelebs
Marna Buys photographed this Common Chaffinch in the Kirstenbosch National Botanical Gardens, within a few kilometres of where the founder population was released. There are 12 records in the BirdPix section of the Virtual Museum. This one is curated at http://vmus.adu.org.za/?vm=BirdPix-61052.
Common Chaffinches were one of many bird species introduced by Cecil John Rhodes in the 1890s. The place of introduction was Rondebosch in the Cape Peninsula. In sharp contrast to the Common Starling, it is still confined mainly to the eastern slopes of the mountain range between roughly Rhodes Memorial and Tokai, and the adjacent suburbs. It must be a rare example of a species which has been introduced, and which, after 120 years has neither gone extinct nor expanded its range. Because of the small population size, this is not an easy species to study, but it certainly presents unique opportunities.
Wrap up
Eight of the 10 alien bird species in South Africa offer opportunities for interesting research projects.
Recommended citation format
Underhill LG 2018. Alien opportunities: 10 bird species with feral populations in South Africa. Biodiversity and Development Institute, Cape Town. Available online at http://thebdi.org/2018/12/23/alien-opportunities-10-bird-species-with-feral-populations-in-south-africa/
If you enjoy wildlife documentaries or scientific articles, you’ve probably seen photos or video taken by “camera traps.” Remote cameras have been used for years by scientists studying or documenting wildlife numbers and behaviour in sometimes difficult or inaccessible terrain. A camera trap is just like an ordinary digital camera except that you don’t have to press a button for a photo to be take, instead the camera is triggered by movement or heat from animals. Camera traps are super handy tools for mapping mammals, they are like little spies in the bush!
Camera trapping has proved to be a very effective way of finding out which elusive and, especially, nocturnal animals are in an area. It’s also an effective way to find out how animals are utilising an area.
Porcupines coming for a drink with a Kudu strolling on by
There is an Animal Demography Unit project for which camera traps play an absolutely crucial role and that is MammalMAP. MammalMAP is the Atlas of African Mammals. The aim of MammalMAP is to update the distribution records for all of Africa’s wild mammals — the small ones, the big ones, the dry ones and the wet ones.
“Surely we know the distributions of Africa’s mammals? These are flagships species for tourism in Africa.” Sadly, the answer is “no” — the distributions are changing due to habitat destruction and climate change. Developing these 21st century distribution maps is filling a critical gap in conservation needs. To effectively manage and conserve wildlife we need to know where they are and we need to understand why they are there. But the reality is that across Africa, our knowledge of the whereabouts of many mammals is, at best – outdated, and, at worst – based on unverified anecdotes. Filling this crucial gap in our knowledge is the main aim of MammalMAP. If you are keen to help us map Africa’s wonderful mammals then setting up a few camera traps is a fun and effective way to do so.
A few tips on setting up camera traps:
It is very important to pick the right site for your camera trap. It helps to be quite sure that an animal will pass by the camera at some stage
Well-used game paths, hiking trails, quiet jeep tracks, dry watercourses and the bottom of ravines are all good places to set up your camera traps
For close shots, like on game paths, at watering holes or food sources set the camera up at no higher than waist height (if you are focusing on smaller animals it is better to set the camera up at a lower position)
If you are in an area where elephants, hyenas or large predators occur, make sure that your hands are free from any unusual or attractive odours e.g. food, perfumes etc. as this might tempt these animals to inspect the source of the odour — and they may just have a pull or a bite at the camera trap to see if its to their liking
Another important factor to keep in mind is the direction of the rising and setting sun. Occasionally when a subject triggers the camera when it is pointed towards the sun as the sun is rising or setting (typically heavy activity hours) this can lead to overexposed or ‘washed-out’ pictures
A leopard caught on camera mid hunt!
You can upload your camera trap photos to MammalMAP at http://vmus.adu.org.za — have fun!
The Hantam is the general area north of Calvinia in the Northern Cape province of South Africa. It’s an arid area, and poorly covered in biodiversity surveys. Citizen scientist Salome Willemse arranged a BioBash for the area, the “Calvinia BioBash”, and found accommodation in a farm house called “’n Handvol Gruis”. The expression, “’n handvol gruis”, literally, “a handful of grit”, comes from a poem by C Louis Leipoldt:
The last verse of “‘n handvol gruis” by C. Louis Leipoldt
For this poet, C. Louis Leipoldt, this area, the Hantam-wyk, was one of the most beautiful places he had experienced. I searched for an English version of this poem which captures the rich mood, but Wikipedia says that Leipoldt’s poetry doesn’t translate easily. In the last line, “arm” means “poor”, “eergister” is “the day before yesterday”, “en” is “and”, “nou” is “now”, and “skatryk” is “treasure rich”. Literally: “Poor the day before yesterday, and now treasure rich.”
Not everyone sees beauty here, but Leipoldt did!
The last line of the poem is about an emotional transformation from poverty to riches. The Calvinia BioBash aimed to make the same transformation, but in a somewhat more practical way. We aimed to transform the biodiversity database of the Hantam from poverty to riches. We certainly didn’t make it “skatryk”, but we enhanced the quality of the data dramatically.
Awesome accommodation for the BioBash. This farmhouse is called ‘n Handvol Gruis, perpetuating the memory of the poet. If you are looking for accommodation in this area, this is a great place to stay.
The main focus of the Calvinia BioBash team was the bird atlas. The map below shows the coverage “before” and “after” the BioBash. Do a bit of visual exercise to see the difference between the two maps. You discover that a lot of pentads were atlased for the first time. Changes in colour between the two coverage maps show pentads which received additional checklists.
Our accommodation at ‘n Handvol Gruis was in the pentad with the blue star. Inspection of the “before” and “after” maps shows that a lot of pentads were atlased for the first time, and the changes in colour in the between the two coverage maps show pentads that received second, third or fourth checklists.
We also worked on enriching the Virtual Museum database (http://vmus.adu.org.za). Between us, with Zenobia van Dyk and myself being chief contributors, we added about 500 records to the various sections of the Virtual Museum. We highlight a few of the records.
Roads are essential for the collection of biodiversity data. They made doing the Calvinia BioBash feasible! However, their direct impact on biodiversity is generally negative. Especially snakes and mammals become road casualties. Taking a photo and uploading it to the Virtual Museum means that the wasted animal is not a total dead loss, unless of course it is the last representative of the species in the district. The largely dried out Puff Adder above became a valuable point in the distribution map for this species. Believe it or not, this is the first ever formal record of Puff Adder in the quarter degree grid cell 3119BC, which lies immediately west of Calvinia, and with good roads. So even the published reptile atlas does not have Puff Adder for this grid cell. In fact, this grid cell has only had five records of reptiles, representing four species since 1980. The Puff Adder is the fourth! To see the map of this grid cell, and a list of the four species, go to http://vmus.adu.org.za/vm_locus_map.php?vm=ReptileMAP&locus=3119BC! This illustrates how much fieldwork still needs to be done!
Taking a photo of this young Yellow Canary was greatly facilitated by the fence. It won’t win a prize for elegance, but the fence is a wonderful perch for BirdPix records. It is in the BirdPix section of the Virtual Museum at http://vmus.adu.org.za/?vm=BirdPix-64300.
Overall, fences are not a positive for biodiversity. But they are a big plus for BirdPixers. We are not bothered by the aesthetics of an ugly barbed wire fence. All we need are images in which the bird is easily identified. Fences provide great perches where we can take photos of a whole bird rather than a partly obscured bird.
Poles are substitute trees, enabling crows to breed in places that would otherwise have very few nest sites. This pair of Cape Crows in in BirdPix at http://vmus.adu.org.za/?vm=BirdPix-64432.
Across much of the arid Karoo, trees are rare. Poles, and the wires between them, provide elevated perches for many bird predators, creating hunting opportunities that never existed before. Predators have an unobstructed view of the ground below, a luxury unavailable in pristine conditions, when the best hunting perch might be a shrub. It is likely that a more serious problem with poles is that they provide substitute trees for the nests of crows. Poles have enabled crows to spread into arid areas of South Africa. Controlling crows is not going to make any long-term difference, because there are plenty of spare crows to take the places of any that are culled. Removing poles might have a long-term impact.
The Hantam River has carved itself a gorge, and a trickle of water was still flowing. The gravel road winds down to the bottom, and the meeting of road and stream makes a fabulous spot to go dragon hunting.
Dragonflies are mostly associated with water. But the Hantam area is arid. So one would expect dragonflies to be as rare as rocking horse droppings. But there are isolated patches of water. There is a wonderful “watersplash” where the Hantam River crosses the gravel road in a remarkable gorge a few kilometres north of the farm Kaalplek. This was probably the best spot in quarter degree grid cell 3119BB for dragonflies. To see the map of this grid cell, and a list of the six species of dragonflies and damselflies recorded here, go to http://vmus.adu.org.za/vm_locus_map.php?vm=OdonataMAP&locus=3119BB!
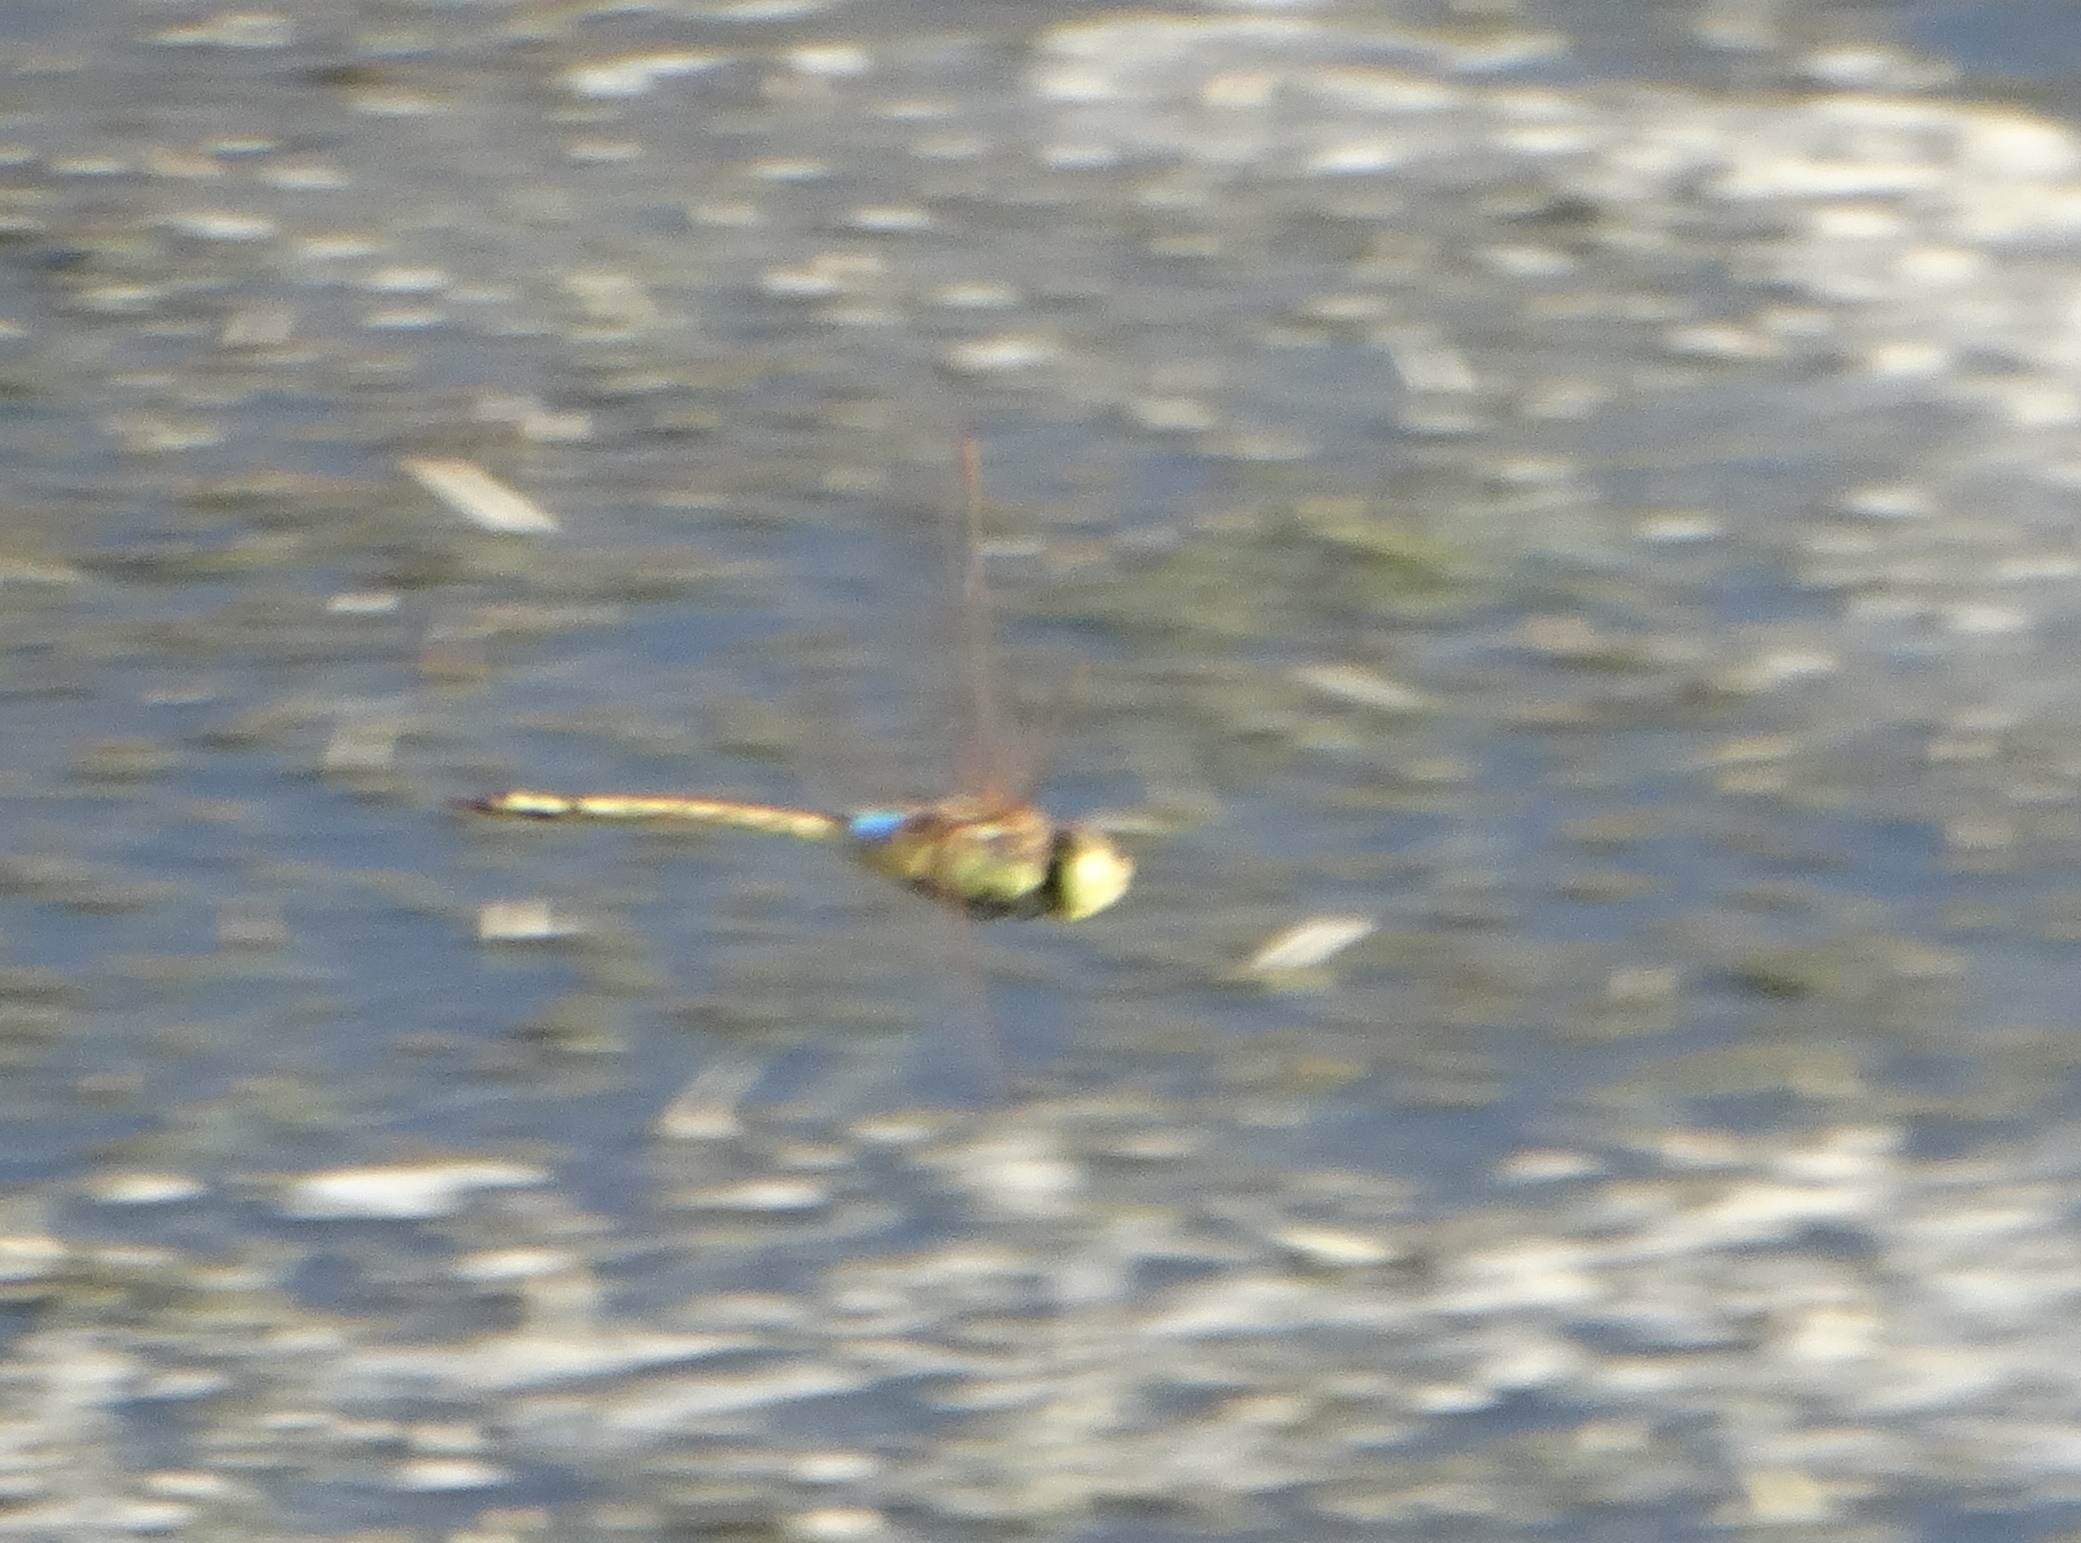
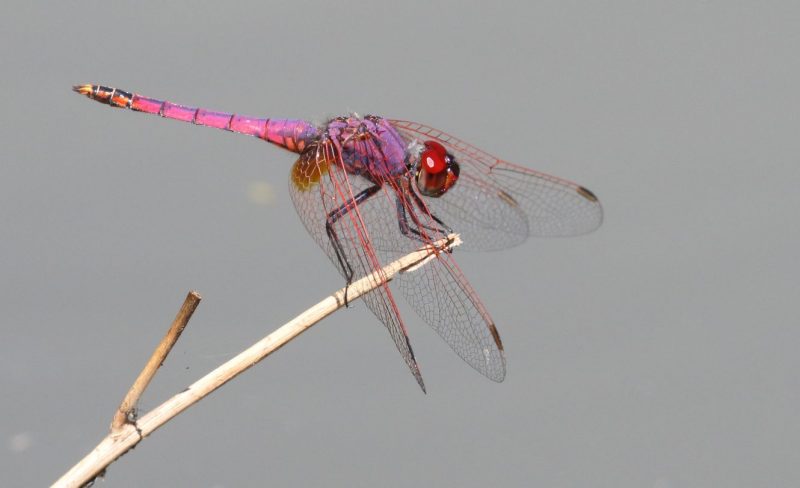
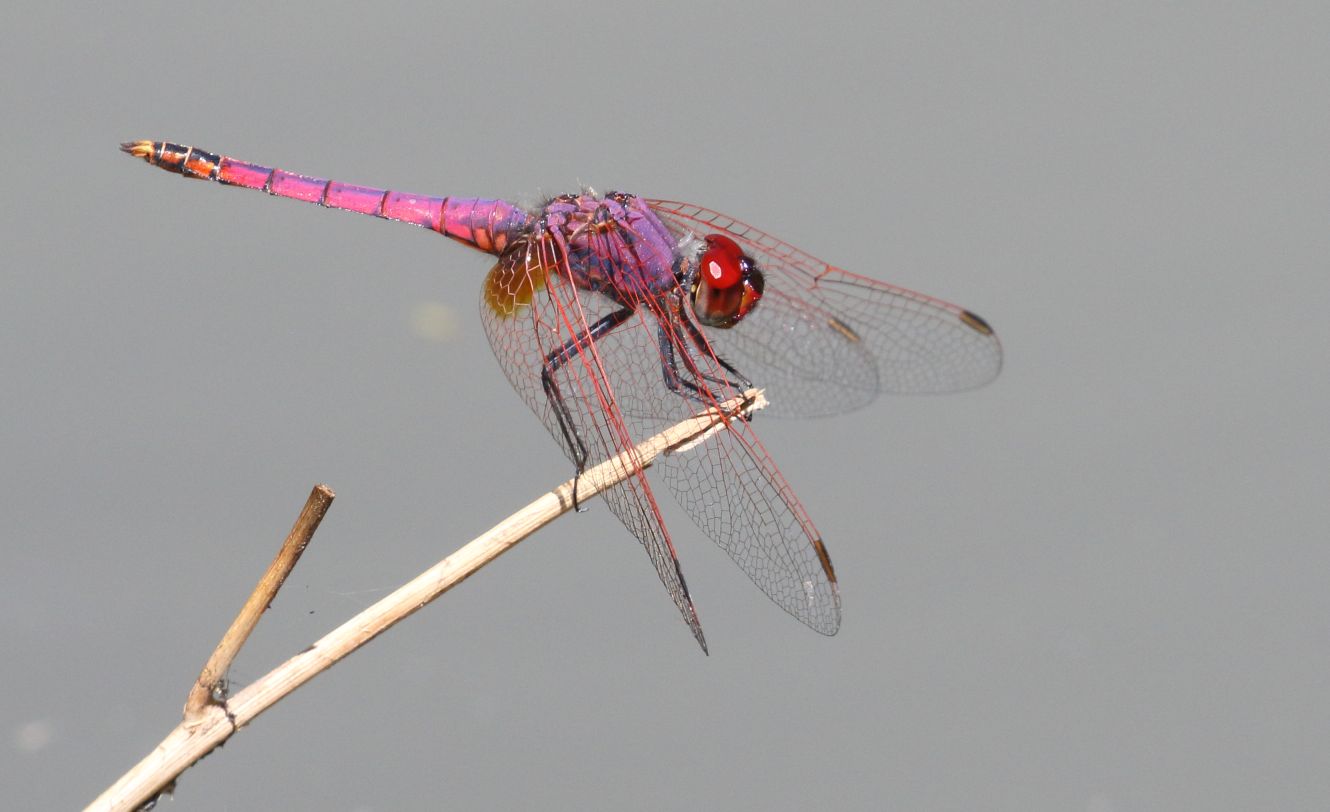
Perhaps the prize record of the Calvinia BioBash for OdonataMAP was this Vagrant Emperor, photographed by Zenobia van Dyk. In the entire Northern Cape, this was the fifth quarter degree grid cell in which the species has been recorded.
Dragonflies of the family called the “emperors” are hard to shoot. They seldom stop for a rest! So we have to do our best to photograph them in flight. This is, without uncertainty, a Vagrant Emperor, because of the blue “saddle” at the back end of the thorax. Zenobia van Dyk shot this dragon at a small spring-fed lake near the farm house ‘n Handvol Gruis. This image is curated at http://vmus.adu.org.za/?vm=OdonataMAP-59371.
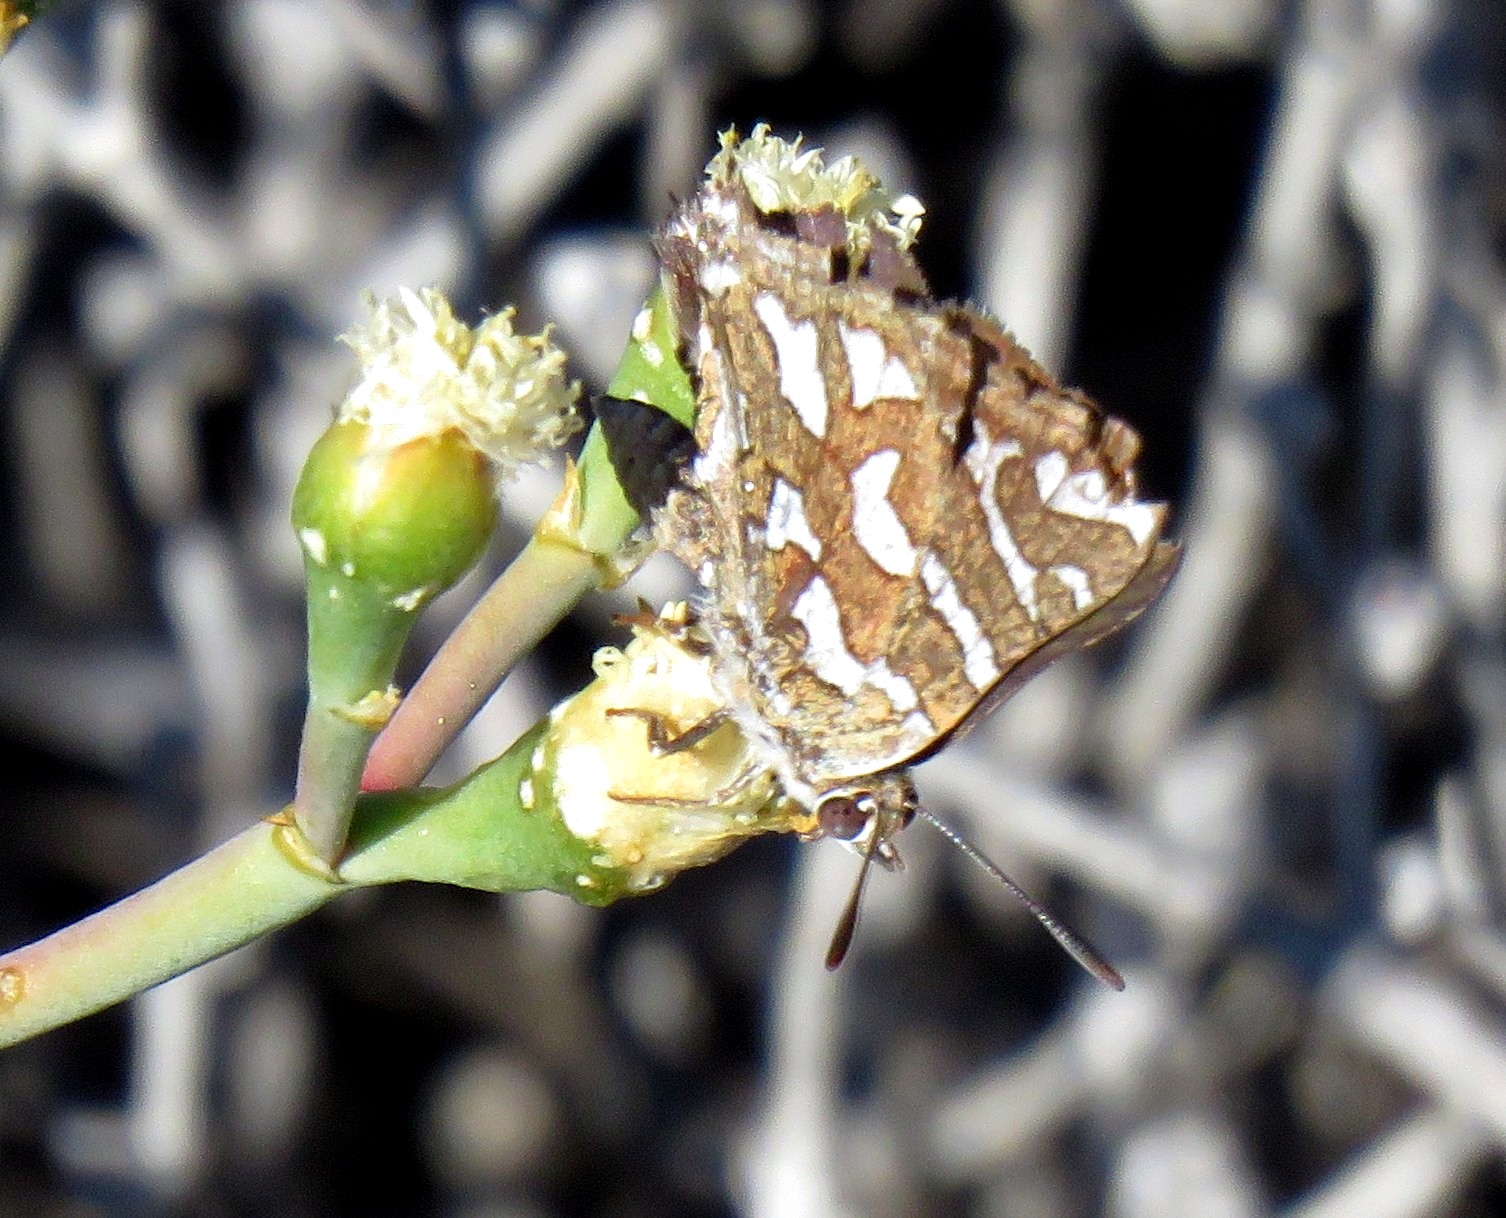
This neat brown and white butterfly is a Namaqua Bar. It was photographed in the Hamtam River gorge. It is the first record of this species in this quarter degree grid cell. So it was not shown here in the butterfly atlas! It is curated here: http://vmus.adu.org.za/?vm=LepiMAP-662313.
At the start of the expedition, the number of butterfly species recorded in quarter degree grid cell 3919BB was seven. Four species were photographed and uploaded. Three were the extremely common and almost ubiquitous African Monarch, Painted Lady and Common Meadow White. The fourth, Namaqua Bar (in the photo above) was identified by Fanie Rautenbach, LepiMAP expert panel. Astonishingly, all four species were new to the grid cell! See the list below! You get the up-to-date list by clicking on http://vmus.adu.org.za/vm_locus_map.php?vm=LepiMAP&locus=3119BB, and you can see if any additional records have been added.
This is the list of LepiMAP species provided by the Virtual Museum for grid cell 3119BB.
All the columns are easy, but the last two need some explanation. The column headed “Last recorded” provides the most recent date on which a species was recorded in the Virtual Museum. This provides you with an insight into how urgently each species needs to be “refreshed”. Ideally, you should download this list before you go into the field, and choose a set of priority species for “refreshment”. A species which was last recorded 10 years or longer ago is definitely needing a new record to confirm that it is still present in the grid cell. Even a three-year old record needs refreshing. If you have a series of photos for a grid cell, upload them all. Don’t worry if some the “Last recorded” dates are recent. Any species which are not already on the list are especially valuable and important!
Every entry in the final column reads “Records”, in blue. Click on this and you will discover it is a link to all the records of the species in the grid cell (including any from before 1980!). But it won’t work here, because this is a photograph of the table! It is fascinating to be empowered to see when the records were made, and who the observer was.
The entrance to the farm Kaalplek
Kaalplek has been mentioned a couple of times above. To an English-speaking South African, with a modest grip on Afrikaans, this translates into “the place where you walk around naked”. This very literal translation does not capture the intended meaning: “the place which is barren and treeless.” The Hantam is a tough area to be a farmer, and the droughts of the past few years have resulted in many of the farms being totally abandoned.
Salome Willemse and Zenobia van Dyk did a reconnaissance trip to find the accommodation and test the roads for quality, and were part of the expedition, from 8 to 12 November 2018. Alan Collett and Tino Herselman traveled west from the Karoo to participate. Eric Hermann traveled north from Hopefield, and I came from Cape Town. We are all grateful to Salome for her coordination and leadership of the expedition. The Calvinia BioBash was citizen science at its best.
Loftie-Eaton M, Underhill LG, and Navarro R. 2018. OdonataMAP – Progress report on the Atlas of the Dragonflies and Damselflies of Africa – 2016/17 and 2017/18. Biodiversity Observations 9.13:1-10
OdonataMAP – Progress report on the Atlas of the Dragonflies and Damselflies of Africa – 2016/17 and 2017/18
Megan Loftie-Eaton
Animal Demography Unit, Department of Biological Sciences, University of Cape Town, Rondebosch, 7701 South Africa; Biodiversity and Development Institute, 25 Old Farm Road, Rondebosch, 7700 South Africa
Les G Underhill
Animal Demography Unit, Department of Biological Sciences, University of Cape Town, Rondebosch, 7701 South Africa; Biodiversity and Development Institute, 25 Old Farm Road, Rondebosch, 7700 South Africa
Rene Navarro
Animal Demography Unit, Department of Biological Sciences, University of Cape Town, Rondebosch, 7701 South Africa; FitzPatrick Institute of African Ornithology, Department of Biological Sciences, University of Cape Town, Rondebosch, 7701 South Africa
Abstract
This paper reports progress with OdonataMAP, the Atlas of Dragonflies and Damselflies of Africa, for the two-year period 1 July 2016 to 30 June 2018. During the two-year review period, the database for the project grew by 30,423 records to 52,257, starting from 22,809 records collected between 2010 and June 2016. Submissions were made from 25 African countries. In six of the nine provinces of South Africa, the number of OdonataMAP records for the province more than doubled. The provinces in which the number of records were not doubled were Gauteng (44% of records made during reporting period), Free State and North West (both 46%). Five observers contributed more than 1000 records over the two-year period, and a further 10 between 500 and 999 records. The total number of observers for the two-year period was 529, compared with 295 in the 2010-16 period. One of the important success of OdonataMAP during the review period was to increase the number of observers, and to reduce the project’s dependence on a small number of citizen scientists.
What is OdonataMAP?
OdonataMAP is the Atlas of Dragonflies and Damselflies of Africa. It was launched in 2010; the first record was uploaded into the OdonataMAP database on 22 September 2010. At the time, the project objectives were (1) “to map the current distribution of the insect Order Odonata, i.e. dragonflies and damselflies, occurring in Africa” and (2) “to serve as a repository of all existing distribution data for this group.”
OdonataMAP provides up-to-date distributions of the dragonflies and damselflies, a critical component of addressing their own conservation priorities, and also the conservation of freshwater ecosystems. The project will provide a valuable input to a revision of the Red List status of each species.
Besides the distribution maps, OdonataMAP aims to make a contribution to understanding the seasonal phenology of these species. Documenting and quantifying changes in seasonality are a critical component of understanding the impacts of climate change on biodiversity (Hassel et al. 2007, Bush et al. 2013).
Thus OdonataMAP aims not only to mainstream the conservation of the Odonata, but also the freshwater habitat on which they (and we) depend. Besides its own value for the conservation of Odonata, this atlas has the potential to influence government policy on the use of water resources, especially for the rural poor. There is no other taxon which has the potential to be so politically prominent in this way.
The report by Underhill et al. (2016) summarized what OdonataMAP had achieved during the period 22 September 2010 until 30 June 2016. The database then contained 22,809 records. The end of June is a natural splitting point for the Odonata year, because it is midwinter in the southern hemisphere and fieldwork is at its lowest ebb. This report focuses on the growth of the database for the two “years”, from 1 July 2016 to 30 June 2017, and from 1July 2017 to 30 June 2018.
The Odonata Database of Africa (ODA) is an open access database developed by a JRS-funded project (Clausnitzer et al. 2012, Dijkstra 2016). This database contains 121,121 records of the distribution of dragonflies and damselflies across Africa and it includes most of the museum specimen records for the region.This database became available online during the last months of 2016, where it is known as African Dragonflies and Damselflies Online (ADDO) (http://addo.adu.org.za/). ADDO is a collaboration between the Department of Conservation Ecology and Entomology (University of Stellenbosch) and the ADU (University of Cape Town). Although the two databases are separate, search queries made to the OdonataMAP database can include a search of the Odonata Database of Africa. This collaboration, completed during the two-year reporting period, represents a major consolidation of data resources.
How many records were submitted to OdonataMAP in the period July 2016 to June 2018, and where in Africa did they come from?
For the years July 2016 to June 2017 and from June 2017 to July 2018, OdonataMAP gained 11,091 and 18,357 records respectively, a total of 30,423 new records, bring the grand total since the start of the project in 2010 to 52,257 records (Table 1). This is an increase from 22,809 records in June 2016, thus 56.4% of the OdonataMAP database has been contributed in the two years under review (Table 1).
Table 1: Annual totals (1 July to 30 June of following calendar year) of submissions of dragonflies and dragonflies to OdonataMAP
Year (July to June)
Number of submissions
Cumulative totals
Cumulative percentage
2010/11
349
349
0.7
2011/12
951
1300
2.5
2012/13
4000
5300
10.1
2013/14
5074
10374
19.9
2014/15
3997
14371
27.5
2015/16
8438
22809
43.6
2016/17
11091
33900
64.9
2017/18
18357
52257
100.0
The records submitted during the two year reporting period came from 25 African countries; the total number of countries for which records have been submitted is now 32 (Table 2). Outside of South Africa, most of the records for the reporting period came from Namibia (491) and more than 100 records from 11 other African countries (Namibia, Botswana, Zambia, Nigeria, Malawi, Angola, Kenya, Mozambique, Zimbabwe, Swaziland, and Sudan). Two records were submitted from countries in the Middle East (Table 2).
Table 2: Numbers of submissions of dragonflies and damselflies to OdonataMAP from countries of Africa (and the Middle East) prior to and during the two-year reporting period
Country
2010-2016
2016/17
2017/18
Total
Angola
14
164
125
303
Benin
5
NA
NA
5
Botswana
213
137
262
612
Democratic Republic of Congo
4
63
44
111
Iraq
NA
NA
1
1
Israel
NA
NA
1
1
Egypt
3
NA
NA
3
Ethiopia
90
NA
NA
90
Gambia
4
NA
NA
4
Ghana
13
68
NA
81
Kenya
82
220
55
357
Lesotho
5
8
NA
13
Liberia
8
8
NA
16
Madagascar
44
NA
NA
44
Malawi
441
144
201
786
Mauritius
1
NA
NA
1
Mozambique
157
19
192
368
Namibia
145
132
359
636
Nigeria
75
320
35
430
Republic of the Congo
7
12
NA
19
Reunion
NA
NA
7
7
Rwanda
6
19
NA
25
Senegal
7
14
NA
21
Seychelles
6
NA
2
8
Sierra Leone
35
76
NA
111
Somalia
1
NA
NA
1
South Africa
20339
9475
17347
47161
Sudan
13
NA
118
131
Swaziland
556
60
89
705
Tanzania
51
3
13
67
Togo
3
NA
NA
3
Uganda
73
29
52
154
Zambia
259
26
334
619
Zimbabwe
144
77
94
315
Total
22804
11074
19331
53209
In six of the nine provinces of South Africa, more than 50% of the total number of records had been submitted in the two-year reporting period (Table 3). The largest percentage increase was for the Western Cape, for which 6,635 records were submitted, 74% of the of the total number of OdonataMAP records for the province. The provinces in which the number of records were not doubled were Gauteng (44% of records during reporting period), Free State and North West (both 46%) (Table 3). Overall, for South Africa as a whole, 57% of records were submitted during the reporting period (Table 3).
Table 3: Numbers of submissions of dragonflies and damselflies to OdonataMAP from the nine provinces of South Africa prior to and during the two-year reporting period. The percentage of records for each province during the reporting period is provided in the final column
Province
2010-2016
2016/17
2017/18
Total
Percentage of records 2016-2018
Eastern Cape
1454
591
1730
3775
61.5
Free State
607
280
241
1128
46.2
Gauteng
1257
529
460
2246
44.0
KwaZulu-Natal
7597
3162
4755
15514
51.0
Limpopo
2845
988
2378
6211
54.2
Mpumalanga
2777
744
2601
6122
54.6
North West
788
266
413
1467
46.3
Northern Cape
566
429
412
1407
59.8
Western Cape
2275
2433
4202
8910
74.5
Total
20166
9422
17192
46780
56.9
What were the outcomes of the Shoot the Dragons Weeks of the past two summers?
OdonataMAP hosted a series of 10 “Shoot the Dragons Weeks” in the summers of the reporting period, three in 2016/17 and seven in 2017/18 (Table 4). They ran from the Saturday of one week to the Sunday of the following week, so that they included two weekends. Their purpose was to promote participation in OdonataMAP, and to maintain momentum in data collection and submission. There is a full description of the results of the very first week (Underhill et al. 2016a). The total number of records submitted during the Shoot the Dragons Weeks was 9,270, so that 30% of the records during the reporting period were submitted during the 10 Shoot the Dragons Weeks. To put this into context, the 90 days of the 10 Weeks represents about 20% of the period of the year when the Odonata are most active. This provides a coarse measure of their effectiveness. Shoot the Dragons Weeks will be repeated in the 2018/19 summer.
Table 4: Shoot the Dragons Weeks for the summers of 2016/17 and 2017/18
Week
Start date
End date
Records
Observers
Countries
Taxa
2016/17
2016/17
1
26 November 2016
4 December 2016
1200
61
8
116
2
21 January 2017
29 January 2017
1384
58
10
120
3
1 April 2017
9 April 2017
634
50
5
83
2017/18
2017/18
1
7 October 2017
15 October 2017
590
48
12
91
2
28 October 2017
5 November 2017
884
54
6
95
3
25 November 2017
3 December 2017
701
53
10
90
4
13 January 2018
21 January 2018
1234
66
9
117
5
10 February 2018
18 February 2018
1073
53
8
112
6
10 March 2018
18 March 2018
745
42
6
92
7
7 April 2018
15 April 2018
825
60
5
92
How is the number of OdonataMAP observers growing?
Five observers contributed more than 1000 records over the two-year period, and a further 10 between 500 and 999 records (Table 5). The most prolific observer contributed 6% to the total number of records; by contrast, in the 2010-16 report (Underhill et al. 2016b), the top two observers contributed 19% and 15% of the total number of records. The total number of observers for the two-year period was 529, compared with 295 in the 2010-16 period (Underhill et al. 2016b). One of the important success of OdonataMAP during the review period was to increase the number of observers, and to reduce the project’s dependence on a small number of citizen scientists.
Table 5: OdonataMAP observers who submitted more than 150 records for the reporting period (1 July 2016 to 30 June 2018)
Observer
Records
Ryan M Tippett
2082
Jean Hirons
1683
Christopher Peter Small
1663
Corrie du Toit
1505
Richard Alan Johnstone
1233
Andries Petrus de Vries & Joey de Vries
895
Desire Darling & Gregg Darling
829
Alan Manson
797
Maritza Van Rensburg
742
Andre Marais
623
Sharon Stanton & Heleen Louw
609
Altha Liebenberg
606
Christopher Willis
575
Alf Taylor & Hilary Harrison
568
Alicia Culverwell
547
Niall Perrins
495
John H Wilkinson
493
Rob Dickinson
468
Bensch Gert & Juan-Pierre Antunes
458
Ilse Hulme
429
Dawie Kleynhans & Sarieta Kleynhans
415
Diana Russell
365
Juan-Pierre Antunes & Gert Bensch
313
Christopher JH Hines
290
Gary Brown
288
Phillip Nieuwoudt
264
Jacobus (Lappies) Labuschagne
262
Pieter La Grange
260
Wilna Steenkamp
255
Bensch Gert
247
Bernardine Alice Altenroxel
227
David Kennedy
209
Juan-Pierre Antunes
207
Zenobia van Dyk
205
Riëtte Griesel
197
Norman Barrett
193
Sharon Basel
192
Katharina Reddig
188
Herb Kageler
181
Sharon Stanton
176
Laban Njoroge
171
Waterberg Team 2017 (Andries Petrus de Vries & Joey de Vries)
167
Pieter Cronje
165
Growing numbers of records generated increased workloads for the expert panel. This is a group of volunteers who either undertake identifications from scratch or confirm the identifications made by the observers. Over the reporting period, the load has been shared mainly between John Wilkinson, Ryan Tippett, Sharon Stanton, Alan Manson, Bertie Brink and Lappies Labushagne. Warwick Tarboton remains the anchor to whom difficult records get referred, and the expert panel has also consulted K-D Dijkstra from time to time.
What are a few of the most remarkable records submitted to OdonataMAP during the past two years?
Figure 1: OdonataMAP record 50330 submitted to OdonataMAP by Christopher Hines from Angola. This is, in all likelihood, a new species. (http://vmus.adu.org.za/?vm=OdonataMAP50330)
Commenting on the original posting of the photo in the Facebook group called Dragonflies and Damselflies of Southern Africa, Jens Kipping, authority on the Odonata of Angola, wrote: “Holy moly, Christopher Hines! First, I thought that somebody from the South American or Asian group sent a picture accidentally. I cannot believe that this is from Angola. I do not have any clue what this libellulid is! It looks a bit like Rhyothemis but also, from the body, a bit like a Palpopleura. This might even be a new genus.” KD Dijkstra, taxonomic authority on African Odonata, subsequently analysed the images, and considered it likely that this might prove to be a new species in the genus Trithemis.
An unexpected and dramatic range expansion occurred during the reporting period. The Ceres Streamjack (also known as Spesbona) Spesbona angusta was described in 1863, but was thought for several decades to be extinct, having not been recorded since 1920. The streams in the area near Ceres, Western Cape, where it had been observed in 1920, had been radically transformed and many no longer flowed due to over-extraction of water for the fruit industry. It was rediscovered in November 2003, when a population was found along the Dutoitsrivier, which flows into the Theewaterskloof Dam, near Villiersdorp, Western Cape, South Africa. This locality is 60 km distant from the original Ceres locality. There are multiple sightings in this immediate Theewaterskloof Dam area (OdonataMAP database), and the IUCN-defined Area of Occupancy is 24 km2 (Samways 2018). For more than a decade, this was thought that this was the only locality where the species occurred. Then, on 10 October 2017, citizen scientist Jean Hirons caused a massive surprise when she photographed the species at a locality near Sedgefield, 330 km due east of the Theewaterskloof site (Figure 2). This raises the obvious question: does it occur at a series of intermediate localities, in suitable habitats along the mountain ranges that link these two isolated sites? The likely answer is yes, because an inspection of Figure 3 of Underhill et al. (2018) reveals that, while fieldwork in the areas of the two known localities of the Ceres Streamjack have been reasonably intensive, the intervening area has been poorly covered by fieldwork, and is regarded as a priority area for future expeditions.
Figure 2: This record, by Jean Hirons, of a Ceres Streamjack (Spesbona) Spesbona angusta in Sedgefield, Western Cape, was 330 km east of the only known locality for the species. (http: //vmus.adu.org.za/?vm=OdonataMAP-35883)
What are the take-home messages?
In a nutshell, the OdonataMAP project grew rapidly in the two-year period under review. From a public-interest perspective, there can be no doubt that the Odonata have been transformed from being the taxon of focus for a minuscule group of enthusiasts, to becoming quite substantial. It is likely that the size of the dragonfly/damselfly community is in the process of overtaking that of the butterfly community, if it has not done so already. It is still far smaller than the bird community, but that is challenge that OdonataMAP is taking on.
Multiple factors have played a role in this growth. Emerging at roughly the same time, they have interacted with each other, and reinforced each other: (1) the publication of the superb fieldguide (Tarboton & Tarboton 2015); (2) the excellently managed Dragonflies and Damselflies of Southern Africa group on Facebook; and (3) the sturdy Virtual Museum platform for uploading images into a long-term database; (4) the award of funding to the Animal Demography Unit at UCT by the JRS Biodiversity Foundation, Seattle, USA.
Growing the broad civil society interest in the Odonata is part of the strategy for meeting the next challenge. This is in fact the challenge set by the JRS Biodiversity Foundation: “How do we get the data into use? How do we mainstream the dragonflies and damselflies so that the OdonataMAP data become serious components of conservation policy making, of environmental impact of assessments, and the thinking of politicians and civil servants?” Our report on the Odonata of the Kruger National Park was an experimental step in that direction (Underhill et al. 2018).
Acknowledgements
John Wilkinson, Alan Manson and Lappies Labuschagne and others made helpful suggestions. We acknowledge funding from the JRS Biodiversity Foundation, Seattle, USA. But above all, we celebrate the amazing contributions made by two teams of citizen scientists: the fieldworkers who contribute the records and the expert panel who undertake the identifications.
References
Clausnitzer V, Dijkstra K-DB, Koch R, Boudot J-P, Darwall WRT, Kipping J, Samraoui B, Samways MJ, Simaika JP, Suhling F 2012. Focus on African freshwaters: hotspots of dragonfly diversity and conservation concern. Frontiers in Ecology and the Environment 10: 129-134
Dijkstra, K-DB 2016. African Dragonflies and Damselflies Online. (Version 1 July 2016). Available online at http://addo.adu.org.za .
Samways MJ, Tarboton W 2006. Rediscovery of Metacnemis angusta (Selys, 1863) in the Western Cape, South Africa (Zygoptera: Matycnemididae). Odonatologica 35: 375-378
Tarboton W, Tarboton M 2015. A Guide to Dragonflies and Damselflies of South Africa. Struik Nature, Cape Town.
Underhill LG, Manson AD, Labuschagne JP, Tippett JM 2016a. Shoot the Dragons Week, Round 1: OdonataMAP grows by 1,200 records. Biodiversity Observations 7.100: 1-14. Available online at https://journals.uct.ac.za/index.php/BO/article/view/393/434
Underhill LG, Navarro R, Manson AD, Labuschagne JP, Tarboton WR 2016b. OdonataMAP: progress report on the atlas of the dragonflies and damselflies of Africa, 2010-2016. Biodiversity Observations 7.47: 1-10. Available online at https://journals.uct.ac.za/index.php/BO/article/view/340
Underhill LG, Loftie-Eaton M, Navarro R 2018. Odonata of the Kruger National Park. Biodiversity Observations 9.11:1-16.
de Swardt DH. 2018. Notes on the seasonal occurrence of Sickle-winged Chats Cercomela sinuata in the central Free State with notes on their seasonality. Biodiversity Observations 9.12:1-5
Notes on the seasonal occurrence of Sickle-winged Chats Cercomela sinuata in the central Free State with notes on their seasonality
Dawid H de Swardt
Department of Ornithology, National Museum, P O Box 266, Bloemfontein 9300, South Africa
Dean (2005) described the status of the Sickle-winged Chat Cercomela sinuata as resident with some altitudinal movements from the Drakensberg escarpment to the lower Lesotho and KwaZulu-Natal areas. These represents mostly C. s. hypernephela (Dean 2005) and this species’ geographic variations are not discussed in Chittenden et al. (2012). Brown & Barnes (1984) first described these movements on the Alpine belt on the Drakensberg escarpment to adjacent lower altitudes. Harrison (1997) described their status (during SABAP1 surveys) with lower summer reporting rates and with winter increases in the central western parts of their distribution (Zone 3 on SABAP1 distribution map) which includes most of the central and western Free State. Harrison (1997) also suggested a seasonal movement into and out of the winter rainfall succulent Karoo areas.
During fieldwork for both the SABAP1 and current SABAP2 bird atlas projects (and BIRP projects), I observed winter seasonal influxes of Sickle-winged Chats in the central parts of the Free State. These winter increases were mostly observed during the April – August period when this species was observed in abundance in its preferred habitat. It is still uncertain from where these individuals originate, but the SABAP2 data will possibly support / explain the suggestion of seasonal influx into and out of the winter rainfall areas of the succulent Karoo to the central parts of their range (Harrison 1997).
The aim of this paper is to analyse the winter / summer seasonal distribution of the Sickle-winged Chat and to analyse its monthly occurrences in certain selected degree grid cells (DGCs). This paper will focus mainly on the central and western Free State and areas in the Western Cape and southern Eastern Cape where seasonality is also suspected to occur.
The distribution of Sickle-winged Chats is presented as winter (April – September) (Figure 1a) and summer (October – March) (Figure 1b) patterns and the higher reporting rates during winter in the central Free State are clearly noticeable (see explanations in Underhill & Brooks 2016). Also the map shows some differences in seasonal reporting rates in the Western Cape and southern Eastern Cape areas.
Figure 1: SABAP2 distribution maps for the winter (a) and summer (b) months for the Sickle-winged Chat, downloaded on 19 April 2017. The higher winter reporting rates (a) in the central parts of Free Sate differ noticeably from the lower reporting rates of the summer map (b). The detailed interpretation of this map is provided by Underhill & Brooks (2016) and see text. There are no data from pentads shaded turquoise. Pentads with white dots have fewer than four checklists but the species was not recorded. Pentads with four or more checklists are either shaded white, species not recorded, or in colour, with shades based on reporting rate: yellow 0-7.9%, orange 7.9-17.0%, light green 17.0-28.9%, dark green 28.9-44.8%, light blue 44.8-64.9% and dark blue 64.9-100%.
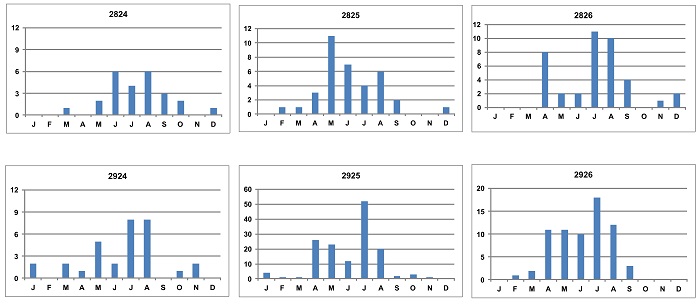
In the central and western parts of the Free State peak reporting rates were recorded in 6 DGCs mostly from April / May to August / September (Figure 2). Lower summer occurrences were also noted. In the more southern Free State (areas along the Gariep River) in DGCs 3024, 3025 and 3026 (not shown in Figure 2), Sickle-winged Chats were recorded in all months, with some summer peaks. During the Birds in Reserves Project (BIRP) which started in 1992 (after SABAP1), there was also a March / April – September peak in reporting rates recorded at Soetdoring and Willem Pretorius Nature Reserves (De Swardt 2000), which supports the SABAP2 data presented in Figure 1a & b. Also, BIRP data from Tussen-die-Riviere Game Reserve near Bethulie (which is along the Gariep River) show a summer peak from August – November.
Figure 2: Bar graphs of degree grid cells (DGCs) in the central and western Free State showing the monthly seasonal patterns of occurrence of Sickle-winged Chats. Note the absence or low reporting rates during the summer months (October – March).
In parts of the Western Cape (see Figure 1a & b) winter to early summer peaks were recorded during SABAP2 (Figure 3). In DGCs 3024, 3025 and 3026 low to high winter peaks were complimented by higher summer reporting rates to early summer reporting peaks during SABAP2 (not shown in Figure 3). In DGC 3324 (not shown in Figures 2 or 3), in the southern Eastern Cape, Sickle-winged Chats were recorded during all months of the year with an August peak, but the seasonal difference in Figure 1a & b is also noticeable. More distribution data are still needed in several DGCs in the Sickle-winged Chat distributional range, especially in low coverage areas.
Figure 3: Bar graphs of degree grid cells (DGCs) in the Western Cape areas showing the monthly seasonal patterns of occurrence of Sickle-winged Chats. Note the higher reporting rates during the summer months and also late winter peaks in some areas.
This is the first time that the seasonal occurrence of Sickle-winged Chats has been analysed based on SABAP2 distributional data, and supports the suggestion that this species is not only resident in certain areas of its range, but that seasonal movements do occur (see Dean 2005, Harrison 1997). It is also the first attempt to analyse the winter influx of Sickle-winged Chats to the central and western Free State based on SABAP2 data, personal observations during the various atlas projects, and earlier published observations (see De Swardt 2000). This study also supports Harrison’s (1997) speculation that movement of this species does occur into and out of the winter rainfall succulent Karoo and the Western Cape areas. Oatley (2017) further recorded Sickle-winged Chats as breeding in the higher altitudes of Lesotho and recorded the species on rare occasions in the Drakensberg foothills in winter. Oatley (2017) further noted and suggested that this species’ migration is mostly westwards towards the Free State, which is supported by the SABAP2 data and personal observations in this study.
A total of 36 Sickle-winged Chats have been ringed so far, most of them in Lesotho, KwaZulu-Natal (Sani Pass areas) and in the Eastern Cape. There is only one ringing record from the Glen area in the central Free State. Also, only one recapture has been obtained with no movement recorded for the individual. A colour ringing study on this species is needed to unravel their seasonal occurrence in the central Free State and other parts of their range.
Acknowledgements
Thanks due to all the Citizen Scientists who submitted SABAP2 cards with Sickle-winged Chats on their lists, and to Les Underhill for producing the Sickle-winged Chat summer / winter maps for this manuscript.
References
Brown CJ, Barnes PR 1984. Birds of the Natal Alpine belt. Lammergeyer 33: 1-13.
Chittenden H, Allan DG, Weiersbye I 2012. Roberts geographic variation of southern African birds. John Voelcker Bird Book Fund: Cape Town.
De Swardt DH 2000. The birds of Soetdoring Nature Reserve and adjacent areas, central Free State. BirdLife South Africa guide pp. 1-40. BirdLife South Africa: Johannesburg.
Dean WRJ 2005. Sickle-winged Chat Cercomelia sinuata In: Hockey PAR, Dean WRJ, Ryan PG. (Eds). Roberts – Birds of Southern Africa (VIIth Ed) Cape Town: The Trustees of the John Voelcker Bird Book Fund. pp. 952-953.
Harrison JA 1997. Sickle-winged Chat. In: Harrison, J.A., Allan, D.G, Underhill, L.G., Herremans, M., Tree, A.J., Parker, V. & Brown, C.J. (Eds.). The atlas of southern African birds. Vol. 2, pp. 180-181. Johannesburg: BirdLife South Africa.
Animal Demography Unit, Department of Biological Sciences, University of Cape Town, Rondebosch, 7701 South Africa; Biodiversity and Development Institute, 25 Old Farm Road, Rondebosch, 7700 South Africa
Megan Loftie-Eaton
Animal Demography Unit, Department of Biological Sciences, University of Cape Town, Rondebosch, 7701 South Africa; Biodiversity and Development Institute, 25 Old Farm Road, Rondebosch, 7700 South Africa
Rene Navarro
Animal Demography Unit, Department of Biological Sciences, University of Cape Town, Rondebosch, 7701 South Africa; FitzPatrick Institute of African Ornithology, Department of Biological Sciences, University of Cape Town, Rondebosch, 7701 South Africa
Abstract
The number of species of dragonflies and damselflies recorded in the Kruger National, South Africa, was 103 in April 2018. This figure was based on a database containing 2,817 records of Odonata, made since 1980, from the 52 quarter degree grid cells which intersect with the Kruger National Park. Records were available for 41 of the 52 grid cells. The most frequently recorded species were Red-veined Dropwing Trithemis arteriosa (167 records) and the Orange-veined Dropwing Trithemis kirbyi (144 records), both recorded in 33 grid cells, and Southern Banded Groundling Brachythemis leucosticta (175 records) and Broad Scarlet (141 records) both in 29 grid cells. Based on records up to April 2018, the median date of the most recent record for species was September 2017, so that half of the 103 species had been recorded during summer 2017/18. This report could be used to motivate the proclamation of the river and wetland systems of the Kruger National Park as a ‘Wetland of International Importance’ in terms of the Ramsar Convention. Two-thirds of the Odonata of South Africa, and one-eighth of the Odonata of Africa, have been recorded in the Kruger National Park.
Dragonflies and damselflies are important indicators of water quality and ecosystem health (Figure 1)
Figure 1. A Barbet Percher Diplacodes luminans recorded by Craig Peter on the southern bank of the Luvuvhu River near Pafuri, Kruger National Park. OdonataMAP record 46300 http://vmus.adu.org.za/?vm=OdonataMAP-46300
Introduction
This document is experimental. It aims to provide a model for the presentation of biodiversity data that can be used by managers and policy makers, by researchers, and by citizen scientists. For these groups of people it aims (1) to provide a snapshot, at a point in time, of the quality and volume of data available for a locality, and (2) aims to provide links to the relevant databases, so they have access to useful summaries of the ongoing data collection effort. In this case the locality is the Kruger National Park, South Africa, and the component of biodiversity under consideration is the Odonata, the dragonflies and the damselflies.
We are looking for suggestions that will improve the usefulness of this product. We are primarily hoping that this review will be on value to managers and policy makers, so it is their information needs which we primarily want to meet.
Study area: Kruger National Park, South Africa
The Kruger National Park (KNP) is the flagship national park of South Africa. The KNP, located in the north-eastern corner of South Africa, was established as a government reserve in 1898 and became South Africa’s first national park in 1926. It was first established to control over-hunting and to protect the dwindling number of herbivores in the Lowveld (Stevenson-Hamilton 1993). The KNP is currently nearly two million hectares in size (19,485 km2). It is a national conservation icon of South Africa and considered to be a safe haven for many fauna and flora. KNP is home to approximately 2,000 species of plant, 53 fish, 34 amphibians, 118 reptiles, 517 birds and 147 mammal species (SANParks 2016).
KNP is about 360 km long from north to south, and about 65 km wide on average, from west to east. Its widest point is 90 km (Paynter & Nussey 1986). The park is bordered by the Limpopo River in the north and the Crocodile River in the south, forming natural park boundaries. Several other rivers run through the park from west to east, including the Sabie, Olifants, Letaba and Luvuvhu Rivers. The Lebombo Mountains lie on the eastern park boundary with Mozambique and to the west the KNP is fringed with many other private nature reserves (forming part of the Greater Kruger National Park) and local communities, villages and towns. The park’s altitude ranges from 200 m to 800 m. The highest point is Khandzalive Hill in the south-west of the park near the Berg-en-Dal rest camp (Paynter & Nussey 1986).
The Lowveld, and consequently the KNP, has a subtropical climate. Subtropical climates are characterised by warm, humid summers and mild, dry winters. Summer temperatures can rise above 38 °C. The rainy season starts around November and lasts until May. The driest period is September and October (SANParks 2016).
Data resources
This document provides information related to the Odonata for the Kruger National Park as well as a selection of species distribution maps. It makes use of the open access database developed by a project funded by the JRS Biodiversity Foundation which generated the Odonata Database of Africa (Clausnitzer et al. 2012, Dijkstra 2016, available online as African Dragonflies and Damselflies Online at http://addo.adu.org.za) and the citizen science database generated by the OdonataMAP project (Underhill et al. 2016, available online at http://vmus.adu.org.za). Both databases are open access. This report is based on species recorded in 52 quarter degree grid cells which fall entirely or partly within the KNP (Table 1, Figure 2). Search queries made to the OdonataMAP database can be extended to include a search of the Odonata Database of Africa, which includes almost all of the museum specimen records for the region. This has been done for this report.
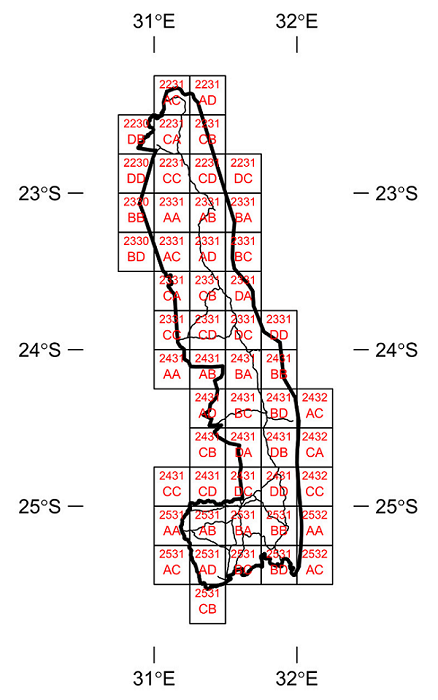
Table 1. The codes for the Quarter Degree Grid Cells (QDGC) which fall fully or partly within the Kruger National Park (KNP). The column headed ‘% in KNP’ provides an estimate of the percentage of the QDGC which lies inside the KNP.
QDGC and name
% in KNP
2230DB HAMAKUYA
17
2230DD KA-XIKUNDU
16
2231AC MABILIGWE
44
2231AD PAFURI
12
2231CA PUNDA MARIA
99
2231CB MACHAYIPAN
50
2231CC DZUNDWINI
100
2231CD SHINGOMENI
83
2231DC
0
2330BB SHANGONI
28
2330BD NSAMA
2
2331AA SHIGOMANE
100
2331AB SHINGWIDZI
100
2331AC NALATSI
91
2331AD DZOMBO
100
2331BA SHINGWIDZI (EAST)
16
2331BC KOSTINI
22
2331CA MAHLANGENI
50
2331CB NGODZI
100
2331CC PHALABORWA
35
2331CD MASORINI
100
2331DA SHILOWA
67
2331DC LETABA
97
2331DD GORGE
19
2431AA GRIETJIE
5
2431AB ROODEKRANS
53
2431AD ORPEN
37
2431BA BALULE
100
2431BB BANGU
62
2431BC MASALA
100
2431BD SATARA
96
2431CB MANYELETI
7
2431CC BOSBOKRAND
0
2431CD NEWINGTON
9
2431DA RIPAPE
77
2431DB LINDANDA
100
2431DC SKUKUZA
63
2431DD TSHOKWANA
100
2432AC
1
2432CA
1
2432CC TSHOKWANA
5
2531AA KIEPERSOL
14
2531AB PRETORIUSKOP
100
2531AC WITRIVIER
0
2531AD GUTSHWA
85
2531BA DUBE
100
2531BB ONDER-SABIE
100
2531BC HECTORSPRUIT
67
2531BD KOMATIPOORT
46
2531CB KAAPMUIDEN
3
2532AA ONDER-SABIE
12
2532AC KOMATIPOORT
4
Figure 2. Locations of the 52 Quarter Degree Grid Cells (QDGCs) which intersect with the Kruger National Park. These are listed in Table 1. The naming convention follows the tradition that has been used in South Africa for almost a century. There are 16 QDGCs in a one-degree grid cell. Each one-degree cell is numbered by the coordinates, latitude first, then longitude, of the northwest corner of the cell. The subdivisions of the one-degree grid cell have an alphabetic notation, as shown.
OdonataMAP data for the Kruger National Park
On 23 April 2018, there were 2,817 records of Odonata in the combined database of OdonataMAP and the Odonata Data Base of Africa, recorded since 1980. Of these, 2663 had been identified to species level, and the remainder to genus level. The number of species recorded for the Kruger National Park was 103 species from eight families (Table 2). Within Table 2, the ordering is first alphabetically by family, and then by genus and species.
Table 2. Species of Odonata recorded in the 52 quarter degree grid cells (Table 1) which intersect with the Kruger National Park, South Africa. The cut-off date is 1980; i.e. records prior to this are not included in this analysis. The number of quarter degree grid cells in which each species has been recorded is given, and n refers to the number of records in joint ADDO-OdonataMAP database for the species. The table lists 103 species.
Species code
Family
Scientific name
Common name
Grid cells
n
Most recent record
664070
Aeshnidae
Anaciaeschna triangulifera
Evening Hawker
1
1
2017/09/01
664120
Aeshnidae
Anax ephippiger
Vagrant Emperor
6
7
2014/03/29
664140
Aeshnidae
Anax imperator
Blue Emperor
20
41
2016/10/06
664170
Aeshnidae
Anax speratus
(Eastern) Orange Emperor
6
9
2012/12/06
664180
Aeshnidae
Anax tristis
Black Emperor
4
5
2012/12/06
664320
Aeshnidae
Gynacantha manderica
Little Duskhawker
1
1
2002/01/01
664470
Aeshnidae
Pinheyschna subpupillata
Stream Hawker
1
1
2001/01/01
660580
Calopterygidae
Phaon iridipennis
Glistening Demoiselle
14
34
2018/01/28
661180
Chlorocyphidae
Platycypha caligata
Dancing Jewel
10
28
2018/01/27
662330
Coenagrionidae
Africallagma glaucum
Swamp Bluet
5
8
2013/02/18
662460
Coenagrionidae
Agriocnemis exilis
Little Wisp
1
1
2001/01/01
662470
Coenagrionidae
Agriocnemis falcifera
White-masked Wisp
1
1
2013/02/18
662630
Coenagrionidae
Azuragrion nigridorsum
Sailing Bluet
11
22
2018/02/03
662720
Coenagrionidae
Ceriagrion glabrum
Common Citril
21
68
2018/03/16
662790
Coenagrionidae
Ceriagrion suave
Suave Citril
1
2
2014/03/29
663100
Coenagrionidae
Ischnura senegalensis
Tropical Bluetail
18
56
2018/03/16
663670
Coenagrionidae
Pseudagrion acaciae
Acacia Sprite
18
52
2017/08/07
663710
Coenagrionidae
Pseudagrion coeleste
Catshead Sprite
2
2
2015/10/13
663720
Coenagrionidae
Pseudagrion commoniae
Black Sprite
18
43
2014/05/04
663360
Coenagrionidae
Pseudagrion gamblesi
Great Sprite
7
15
2016/07/12
663410
Coenagrionidae
Pseudagrion hageni
Painted Sprite
4
10
2017/01/27
663780
Coenagrionidae
Pseudagrion hamoni
Swarthy Sprite
23
91
2018/03/16
663460
Coenagrionidae
Pseudagrion kersteni
Powder-faced Sprite
16
35
2017/01/23
663820
Coenagrionidae
Pseudagrion massaicum
Masai Sprite
17
72
2017/12/01
663560
Coenagrionidae
Pseudagrion salisburyense
Slate Sprite
7
10
2015/11/23
663870
Coenagrionidae
Pseudagrion sjoestedti
Variable Sprite
6
11
2014/03/28
663880
Coenagrionidae
Pseudagrion sublacteum
Cherry-eye Sprite
19
58
2018/01/27
663890
Coenagrionidae
Pseudagrion sudanicum
Blue-sided Sprite
5
17
2017/10/07
664550
Gomphidae
Cerato-gomphus pictus
Common Thorntail
1
1
2006/12/12
664640
Gomphidae
Creni-gomphus hartmanni
Clubbed Talontail
9
16
2016/05/17
664770
Gomphidae
Gomphidia quarrei
Southern Fingertail
3
6
2016/12/27
664830
Gomphidae
Ictino-gomphus ferox
Common Tigertail
16
51
2018/01/28
664880
Gomphidae
Lestino-gomphus angustus
Spined Fairytail
4
5
2012/11/24
665300
Gomphidae
Neuro-gomphus zambeziensis
Zambezi Siphontail
4
10
2017/12/08
665480
Gomphidae
Notogomphus praetorius
Yellowjack Longleg
1
1
2013/01/25
665640
Gomphidae
Onycho-gomphus supinus
Lined Claspertail
1
1
2002/01/01
665740
Gomphidae
Paragomphus cognatus
Rock Hooktail
4
6
2017/01/23
665780
Gomphidae
Paragomphus elpidius
Corkscrew Hooktail
10
15
2018/01/27
665790
Gomphidae
Paragomphus genei
Common Hooktail
17
36
2017/11/18
665840
Gomphidae
Paragomphus magnus
Great Hooktail
5
6
2017/03/20
665890
Gomphidae
Paragomphus sabicus
Flapper Hooktail
5
9
2018/01/14
666070
Gomphidae
Phyllogom-phus selysi
Bold Leaftail
3
4
2018/02/20
660410
Lestidae
Lestes pallidus
Pallid Spreadwing
7
8
2017/11/21
660360
Lestidae
Lestes plagiatus
Highland Spreadwing
5
10
2018/01/30
660330
Lestidae
Lestes tridens
Spotted Spreadwing
2
2
2002/01/01
660370
Lestidae
Lestes uncifer
Sickle Spreadwing
5
5
2018/03/23
660300
Lestidae
Lestes virgatus
Smoky Spreadwing
1
2
2013/02/18
666750
Libellulidae
Acisoma inflatum
Stout Pintail
3
3
2017/01/20
666770
Libellulidae
Acisoma variegatum
Slender Pintail
4
12
2018/03/16
666920
Libellulidae
Aethriamanta rezia
Pygmy Basker
1
1
1992/01/01
667020
Libellulidae
Brachythemis lacustris
Red Groundling
16
50
2018/01/27
667030
Libellulidae
Brachythemis leucosticta
Southern Banded Groundling
29
175
2018/03/22
667060
Libellulidae
Bradinopyga cornuta
Horned Rockdweller
10
15
2018/03/16
667090
Libellulidae
Chalcostephia flavifrons
Inspector
2
32
2018/02/04
667130
Libellulidae
Crocothemis erythraea
Broad Scarlet
29
143
2018/03/16
667140
Libellulidae
Crocothemis sanguinolenta
Little Scarlet
7
12
2015/10/09
667200
Libellulidae
Diplacodes lefebvrii
Black Percher
15
42
2018/03/22
667210
Libellulidae
Diplacodes luminans
Barbet Percher
14
22
2018/03/22
667380
Libellulidae
Hemistigma albipunctum
African Piedspot
5
11
2017/09/01
667690
Libellulidae
Nesciothemis farinosa
Eastern Blacktail
21
105
2018/02/04
667730
Libellulidae
Notiothemis jonesi
Eastern Forest-watcher
3
4
2012/12/06
667760
Libellulidae
Olpogastra lugubris
Bottletail
4
5
2017/11/29
667780
Libellulidae
Orthetrum abbotti
Little Skimmer
2
2
2012/12/06
667830
Libellulidae
Orthetrum brachiale
Banded Skimmer
1
1
2014/03/29
667860
Libellulidae
Orthetrum caffrum
Two-striped Skimmer
1
1
2007/01/27
667900
Libellulidae
Orthetrum chrysostigma
Epaulet Skimmer
24
91
2018/01/28
667930
Libellulidae
Orthetrum hintzi
Dark-shouldered Skimmer
3
4
2017/11/01
667940
Libellulidae
Orthetrum icteromelas
Spectacled Skimmer
1
1
2011/03/07
667950
Libellulidae
Orthetrum julia
Julia Skimmer
13
45
2018/02/04
668000
Libellulidae
Orthetrum machadoi
Highland Skimmer
3
27
2018/02/20
668110
Libellulidae
Orthetrum stemmale
Bold Skimmer
9
36
2018/02/20
668120
Libellulidae
Orthetrum trinacria
Long Skimmer
19
43
2018/01/30
668180
Libellulidae
Palpopleura deceptor
Deceptive Widow
4
16
2014/05/04
668190
Libellulidae
Palpopleura jucunda
Yellow-veined Widow
5
7
2014/05/02
668200
Libellulidae
Palpopleura lucia
Lucia Widow
22
68
2018/02/20
668210
Libellulidae
Palpopleura portia
Portia Widow
10
21
2017/11/26
668230
Libellulidae
Pantala flavescens
Wandering Glider
22
61
2018/01/28
668370
Libellulidae
Rhyothemis semihyalina
Phantom Flutterer
8
15
2016/04/11
668420
Libellulidae
Sympetrum fonscolombii
Red-veined Darter or Nomad
4
4
2014/04/27
668540
Libellulidae
Tetrathemis polleni
Black-splashed Elf
8
15
2018/02/03
668600
Libellulidae
Tholymis tillarga
Twister
1
1
2012/02/10
668620
Libellulidae
Tramea basilaris
Keyhole Glider
13
17
2018/01/31
668630
Libellulidae
Tramea limbata
Ferruginous Glider
10
13
2014/11/18
668740
Libellulidae
Trithemis aconita
Halfshade Dropwing
6
10
2018/01/30
668660
Libellulidae
Trithemis annulata
Violet Dropwing
16
114
2018/03/23
668670
Libellulidae
Trithemis arteriosa
Red-veined Dropwing
33
167
2018/01/30
668800
Libellulidae
Trithemis donaldsoni
Denim Dropwing
7
8
2017/01/23
668870
Libellulidae
Trithemis dorsalis
Highland Dropwing
2
2
2016/02/02
668890
Libellulidae
Trithemis furva
Navy Dropwing
3
6
2017/01/27
669120
Libellulidae
Trithemis kirbyi
Orange-winged Dropwing
33
144
2018/03/17
668900
Libellulidae
Trithemis pluvialis
Russet Dropwing
3
9
2016/06/07
669080
Libellulidae
Trithemis stictica
Jaunty Dropwing
5
5
2015/03/14
669130
Libellulidae
Trithemis werneri
Elegant Dropwing
7
26
2018/03/15
669180
Libellulidae
Urothemis assignata
Red Basker
10
22
2016/05/18
669190
Libellulidae
Urothemis edwardsii
Blue Basker
8
13
2016/04/11
669250
Libellulidae
Zygonoides fuelleborni
Southern Riverking
9
13
2016/12/27
669390
Libellulidae
Zygonyx natalensis
Blue Cascader
7
12
2017/11/29
669420
Libellulidae
Zygonyx torridus
Ringed Cascader
16
24
2014/05/04
666420
Macromiidae
Phyllomacro-mia contumax
Two-banded Cruiser
7
9
2014/05/01
666620
Macromiidae
Phyllomacro-mia picta
Darting Cruiser
8
10
2017/12/01
661480
Platycnemididae
Allocnemis leucosticta
Goldtail
2
3
2015/03/14
661810
Platycnemididae
Elattoneura glauca
Common Threadtail
13
37
2018/01/30
661640
Platycnemididae
Mesocnemis singularis
Common (Forest/ Savanna) Riverjack
9
13
2017/01/23
The Red-veined Dropwing Trithemis arteriosa (167 records) and the Orange-veined Dropwing Trithemis kirbyi (144 records) were both recorded in 33 of the quarter degree grid cells of the Kruger National Park, and Southern Banded Groundling Brachythemis leucosticta (175 records) and Broad Scarlet (141 records) in 29 grid cells (Table 2). These four dragonflies were the most widely distributed species.
The dataset is commendably “young” (final column of Table 2). Based on records up to April 2018, the median date of the most recent record for species was September 2017. In other words, half of the 103 species had been recorded during the most recent eight-month period, i.e. in summer 2017/18. The lower quartile was in March 2015, indicating that three-quarters of the species have been recorded in the most recent three years.
Special attention needs to be focused on “refreshing” the records of the species in oldest quartile; in this case, it is species not recorded since 2015. Of species recorded since 1980, nine have not been recorded for more than 10 years, i.e. prior to 2008 (Table 2). Common Thorntail Ceratogomphus pictus was last recorded on 12 December 2006, Two-striped Skimmer Orthetrum caffrum was last recorded on 27 January 2007, and Spectacled Skimmer Orthetrum icteromelas was last recorded on 7 March 2011 (Table 2). For a further six species, only the year of the last record is available: Pygmy Basker Aethriamanta rezia (1992), Steam Hawker Pinheyschna subpupillata and Little Wisp Agriocnemis exilis (2001), and Spotted Spreadwing Lestes tridens, Lined Claspertail Onychogomphus supinus and Little Duskhawker Gynacantha maderica (2002). Eight of these nine species have been recorded only once in the Kruger National Park since 1980, and the Spotted Spreadwing twice (Table 2). The presence of these species needs careful evaluation. Six species were last recorded in 2012, four in 2013, and 11 in 2014.
Of the species in the “oldest” quartile, three had been recorded in more than 10 grid cells: Black Sprite Pseudagrion commoniae (18 grid cells, 43 records), Ringed Cascader Zygonyx torridus (16 grid cells, 24 records) and Ferruginous Glider Tramea limbata (10 grid cells, 13 records) (Table 2). The current status of these three species should be investigated. They were last recorded in 2014 (Table 2).
The maximum number of species of Odonata in any of the 52 quarter degree grid cells of the Kruger National Park was 60 (Figure 3). The median was 12 species. Eleven grid cells had no records of Odonata. Most of these grid cells have only a small percentage of their area within the Kruger National Park, and those on the eastern edge of the park are mostly in Mozambique and are virtually inaccessible even from within that country (Peter Lawson pers. comm.). If these grid cells are excluded from the calculation, the median number of species per grid cell is 21.
Figure 3. Species richness of the Odonata (dragonflies and damselflies) in the Quarter Degree Grid Cells (QDGC) which intersect with the Kruger National Park. Refer to Figure 2 and Table 1 for the naming conventions of each QDGC.
Table 3. The number of species recorded in each of the 41 quarter degree grid cells intersecting with the Kruger National Park which have Odonata data. The quarter degree grid cell code is provided, the number of species recorded, and the number of records of these species. Because of the difficulty of making identifications of species with certainty from photographs, some records are identified to genus or family. The final column gives the total number of records for the grid cell in the database.
QDGC
No. of species
Records identified to species level
Number of taxa
Total number of records
2230DB HAMAKUYA
36
58
37
59
2231AC MABILIGWE
42
69
46
75
2231AD PAFURI
48
122
48
122
2231CA PUNDA MARIA
30
77
31
78
2231CC DZUNDWINI
20
46
21
48
2231CD SHINGOMENI
15
20
16
21
2331AB SHINGWIDZI
28
77
30
79
2331AD DZOMBO
3
7
4
8
2331BA SHINGWIDZI (OOS)
9
11
12
15
2331BC KOSTINI
11
18
12
19
2331CA MAHLANGENI
8
8
8
8
2331CB NGODZI
25
112
27
117
2331CC PHALABORWA
8
16
9
17
2331CD MASORINI
7
10
8
12
2331DA SHILOWA
4
5
5
6
2331DC LETABA
45
194
48
197
2331DD GORGE
4
9
4
9
2431AA GRIETJIE
42
258
48
291
2431AB ROODEKRANS
3
3
3
3
2431AD ORPEN
3
3
5
5
2431BA BALULE
29
88
33
95
2431BB BANGU
21
27
22
29
2431BC MASALA
13
16
13
16
2431BD SATARA
25
52
27
54
2431CB MANYELETI
20
35
24
40
2431CC BOSBOKRAND
9
10
10
11
2431CD NEWINGTON
47
154
53
167
2431DA RIPAPE
5
6
5
6
2431DB LINDANDA
4
4
4
4
2431DC SKUKUZA
60
244
66
253
2431DD TSHOKWANA
55
133
58
138
2531AA KIEPERSOL
59
211
64
218
2531AB PRETORIUSKOP
8
13
9
14
2531AC WITRIVIER
25
49
28
54
2531AD GUTSHWA
21
37
24
47
2531BA DUBE
12
16
12
16
2531BB ONDER-SABIE
44
101
48
105
2531BC HECTORSPRUIT
54
152
58
158
2531BD KOMATIPOORT
50
370
57
394
2531CB KAAPMUIDEN
51
114
51
114
2532AA ONDER-SABIE
1
1
1
1
What is immediately clear from Figure 3 is that the species richness within the park appears to be spatially uneven, with no strong geographical pattern (such as a decrease from north to south, or east to west). Figure 3 is the result of two confounded processes: the fieldwork behaviour of the observers (technically, the observer process) and the truth on the ground (the biological process). Although there is likely to be variation in the number of species per grid cell, due to the uneven distribution of suitable wetland habitat for Odonata, the true variation is unlikely to be as large as depicted in Figure 3. The challenge for fieldwork in the Kruger National Park is that the dragonflies and damselflies share their habitat with Nile Crocodiles Crocodylus niloticus, Common Hippopotamuses Hippopotamus amphibious and other life-threatening animals. As a result, and in accordance with the SANParks code of conduct for visitors to the Kruger National Park, most river systems and wetlands are out of bounds; this makes consistent recording of especially the damselflies difficult, and introduces a bias into the data.
In spite of this, it is probably feasible, now that the unevenness of the observer effort is displayed (Figure 3), that the citizen scientists who are the primary contributors of data to OdonataMAP will find a way to reduce as much of the bias introduced by the observer process as feasible.
Distribution maps, generated in May 2018, are provided for a sample of four species, selected to illustrate various levels of occurrence in the Kruger National Park (Figures 4 and 5). Up-to-date distribution maps (i.e. for use in the future) for all species can be obtained from the following link:
Figure 4. Distribution maps for the Red-veined Dropwing *Trithemis arteriosa* and the Epaulet Skimmer *Orthretrum chrysostigma* in the Kruger National Park and surrounding areas. The Red-veined Dropwing has been recorded in 33 of the 52 QDGCs which intersect with the Kruger National Park, the most widespread species, and the Epaulet Skimmer in 24. The distribution beyond the Kruger National Park is displayed on these maps.
This gives the map for the species with species code number 668670, the Red-veined Dropwing (Figure 4). The species codes are provided in the first column of Table 2.
Figure 5. Distribution maps for the Violet Dropwing *Trithemis annulata* and the Darting Cruiser *Phyllomacromia picta* in the Kruger National Park and surrounding areas. The Violet Dropwing has been recorded in 16 of the 52 QDGCs which intersect with the Kruger National Park and the Darting Cruiser in eight. The distribution beyond the Kruger National Park is displayed in these maps.
Up-to-date lists of the species recorded in a quarter degree grid cell can be obtained from the following link. The list of grid cell codes is provided in Table 1. In the link below, replace the “locus” with the code for the QDGC required (consult also Figure 2):
These lists are constructed to the same format as that of Table 2, including the provision of the most recent record of each species in the grid cell. The list can be copied and pasted to Excel, where they can be sorted and manipulated as needed. These list include numbers of records for which the expert panel was unable to make an identification to “species” level.
Earlier studies of the Odonata of the Kruger National Park
Three key papers have been written which focus on the Odonata of the Kruger National Park (Table 4). The first was a list of 21 species recorded by Balinsky (1965). Three decades late, Clark & Samways (1994) generated a list of 80 species, based on three sources: the 21 species by Balinsky (1965), their own list of 59 species from along the Sabie River, and a list of 61 species generated by “other collectors” in the period between Balinsky’s fieldwork and their own. Clark & Samways (1994) noted that there were three species which had only been recorded by Balinsky (1965); these are included in the list of Table 2; i.e. their presence has been confirmed. They also noted that there were 11 species which were only on the list made by “other collectors”. All except one of these species is included in Table 2; the exception is Cryptic Syphontail Neurogomphus vicinus, a species which has only been recorded from its type locality in the Democratic Republic of Congo (Schouteden 1934); so this species represents an error.
Table 4. Papers which focus on reviews of the Odonata (dragonflies and damselflies) of the Kruger National Park.
Reference
Summary
Balinsky BI 1965. A preliminary list of the dragonflies (Odonata) of the Kruger National Park. Koedoe 8: 95-96
Based on a total of 84 specimens collected in the Kruger National Park, this paper provided a list of 21 species. At the end of this Balinsky provides reasons why ‘the present list includes only a small fraction of the dragonfly species occurring in the Park.’
Clark TE, Samways MJ 1994. An inventory of the damselflies and dragonflies (Odonata) of the Kruger National Park, with three new South African records. African Entomology 2: 61-64
Using the list by Balinsky (1065) as baseline, made three decades previously, records made by other researchers, and their own data from a study of the Odonata along the Sabie River, the authors extended the list to 81.
Clark TE, Samways MJ 1996. Dragonflies (Odonata) as indicators of biotope quality in the Kruger National Park, South Africa. Journal of Applied Ecology 33: 1001-1012
This paper demonstrated how the Odonata can be used to undertake biomonitoring of the Sabie River. Ten ‘biotopes’ (waterbody types) were identified, and the Odonata species characteristic of each were identified using multivariate statistical methods.
It is remarkable how the list of Odonata species has grown in the past five decades, from 21 to 80 and currently 103 (Tables 2 and 4). It is even more remarkable that two-thirds of South Africa’s species of Odonata (Tarboton & Tarboton 2015) have been recorded in the quarter degree grid cells which intersect with the Kruger National Park.
Conclusions and recommendations
This paper has aimed to highlight the contents of the OdonataMAP database, in relation to the Kruger National Park, providing a snapshot from April-May 2018. But it also provides the tools to enable users (1) to obtain up-to-date species distribution maps for the dragonflies and damselflies of the Kruger National Park, and (2) to obtain up-to-date species lists on the scale of the quarter degree grid cell. These maps and lists are extracted “on the fly” from the live database for the project when the queries are made.
These distribution maps and species lists can only be comprehensive if the OdonataMAP database contains the entire knowledge base. One of the concerns of the second decade of the 21st century is the proliferation of a variety of biodiversity data collection initiatives. This serves to split (and confuse) the citizen scientist community, which is in any event small, and to generate a diversity of databases which do not communicate with each other, and ultimately result in products such as those produced within this system being incomplete. The OdonataMAP database (supplemented by the Odonata Data Base of Africa (Clausnitzer et al. 2012, Dijkstra 2016) which contains the overwhelming majority of specimen records in museum collections, and the observations of taxon specialists), is currently the most reliable and up to date database of the Odonata in Africa, and growing rapidly (Underhill et al. 2016).
We are seeking suggestions for additional resources which would be perceived valuable. For example, both managers and citizen scientists might be interested in a species map which shows the time elapsed, in appropriate units, since the species was recorded in each grid cell. From a management perspective, if a pattern emerges, it is a warning that a species is becoming hard to locate in an area, and that it might be going extinct there. From the citizen scientist perspective, this knowledge provides an incentive of which species need to be “refreshed” in each grid cell. Another example might be a table which shows the median date of the records from each quarter degree grid cell. From both management and citizen scientist perspective, this provides guidance as to where observer effort should be focused.
How can these data be used for annual monitoring of Odonata in the Kruger National Park? Because the bulk of the records are made by citizen scientists it is difficult to impose a strict protocol on data collection. However, with some ingenuity, it ought to be feasible to encourage citizen scientists, cumulatively, to visit as many grid cells as they are able, and to use these data some form of occupancy modelling to estimate changes in distribution and seasonality through time. There is a natural annual pattern to the occurrence of adult dragonflies and damselflies, with a winter lull. This annual cycle can be used to plan citizen scientist data collection strategies for the upcoming summer.
Given the hazards of doing fieldwork in the presence of dangerous wild animals (and in fact the understandable prohibition on this by SANParks for citizen scientists), it is not going to be feasible to undertake a complete survey of the distribution of dragonflies and damselflies of the Kruger National Park. It is therefore sensible to think in terms of using species distribution models to achieve this (Elith & Leathwick 2009, Franklin 2009, Guisan et al. 2013). Although in this paper, the data have been summarized in terms of quarter degree grid cells, the overwhelming majority of the individual records are georeferenced. This means that it is possible to use a species distribution model system such as MaxEnt to generate plausible distributions of species (Elith et al. 2011).
Finally, this paper ends up effectively being a motivation for the proclamation of the Kruger National Park, or at least its river and wetland systems, as a “Wetland of International Importance” in terms of the Ramsar Convention (Ramsar Convention on Wetlands 2016). About two-thirds of the Odonata ever recorded in South Africa have been recorded here. About one-eighth of the Odonata of the continent of Africa have been recorded in the Kruger National Park.
Acknowledgements
The primary acknowledgement needs to be attributed to the people who collected the data, both professional entomologists and citizen scientists. We acknowledge funding support from the JRS Biodiversity Foundation. Many people commented on earlier drafts.
References
Balinsky BI 1965. A preliminary list of the dragonflies (Odonata) of the Kruger National Park. Koedoe 8: 95-96.
Clark TE, Samways MJ 1994. An inventory of the damselflies and dragonflies (Odonata) of the Kruger National Park, with three new South African records. African Entomology 2: 61-64.
Clark TE, Samways MJ 1996. Dragonflies (Odonata) as indicators of biotope quality in the Kruger National Park, South Africa. Journal of Applied Ecology 33: 1001-1012.
Clausnitzer V, Dijkstra K-DB, Koch R, Boudot J-P, Darwall WRT, Kipping J, Samraoui B, Samways MJ, Simaika JP, Suhling F 2012. Focus on African freshwaters: hotspots of dragonfly diversity and conservation concern. Frontiers in Ecology and the Environment 10: 129-134
Dijkstra, K-DB 2016. African Dragonflies and Damselflies Online. (Version 1 July 2016). Available online at http://addo.adu.org.za .
Elith J, Leathwick JR 2009. Species distribution models: ecological explanation and prediction across space and time. Annual Review of Ecology, Evolution and Systematics 40: 677-697.
Elith J, Phillips SJ, Hastie T, Dud KM, Chee YE, Yates CJ 2011. A statistical explanation of MaxEnt for ecologists. Diversity and Distributions 17: 43-57.
Franklin J 2009. Mapping Species Distributions: Spatial Inference and Prediction. Cambridge University Press, Cambridge, UK.
Guisan A, Tingley R, Baumgartner JB, Naujokaitis-Lewis I, Sutcliffe PR, Tulloch AIT, Regan TJ, Brotons L, McDonald-Madden E, Mantyka-Pringle C, Martin TG, Rhodes JR, Maggini R, Setterfield SA, Elith J, Schwartz MW, Wintle BA, Broennimann O, Austin M, Ferrier S, Kearney MR, Possingham HP, Buckley, YM 2013. Predicting species distributions for conservation decisions. Ecological Letters 16:1424-1435.
Paynter D, Nussey W 1986. Die Krugerwildtuin in Woord en Beeld. Macmillan Suid-Afrika, Johannesburg.
Ramsar Convention on Wetlands 2016. An Introduction to the Ramsar Convention on Wetlands. Ramsar Convention Secretariat, Gland, Switzerland.
SANParks 2016. South African National Parks. Kruger National Park: Introduction. Retrieved from https://www.sanparks.org/parks/kruger/ on 5 October 2016.
Schouteden H 1934. Les Odonata des Congo Belge. Annales Musée Congo Belge. Zoologie Serie 3 Section 2. Catalogue Raisonnés de la Fauna Entomolgique du Congo Belge Tome 3, Fascicule 1: 1-84.
Stevenson-Hamilton J 1993. South African Eden: The Kruger National Park 1902-1946. Struik Publishers, Cape Town.
Tarboton W, Tarboton M 2015. A Guide to Dragonflies and Damselflies of South Africa. Struik Nature, Cape Town.
Underhill LG, Navarro R, Manson AD, Labuschagne JP, Tarboton WR 2016. OdonataMAP: progress report on the atlas of the dragonflies and damselflies of Africa, 2010-2016. Biodiversity Observations 7.47: 1-10. Available online at http://bo.adu.org.za/content.php?id=240
Elith J, Leathwick JR 2009a. Species distribution models: ecological explanation and prediction across space and time. Annual Review of Ecology, Evolution and Systematics 40: 677-697.
Franklin J 2009. Mapping Species Distributions: Spatial Inference and Prediction. Cambridge University Press, Cambridge, UK.
How frequently can the species in the photograph be identified?
We asked this question “What’s the value of a photo?” of seven of the taxa in the Virtual Museum (http://vmus.adu.org.za). We looked at scorpions, lacewings, birds, frogs, reptiles, butterflies, and dragonflies and damselflies.
What happens is this. Citizen scientists upload their photographs into the Virtual Museum. A record can consist of one to three photographs. The second and third photographs are usually used to show different angles on the animal, or they can be used to show habitat. They will know that the record is butterfly, and that it ought to be submitted to LepiMAP, and that the scorpions go to ScorpionMAP, etc. But they don’t need to know what species they are uploading (although they can submit their identification, or even tentative identification). For each of these groups of species, there is an expert panel consisting of specialists, often citizen scientists themselves. These experts do their best to make an identification to species (or even subspecies level for some butterflies and reptiles). But they are careful, and if the identification cannot be made with certainty to species level, they allocate a genus, and sometimes even a family. This mostly happens when the photo is a bit blurred, or if the critical ID feature is not shown. And some species can only be identified when the species is captured, and the critical diagnostic features, often the genitals, are examined with a magnifying glass! The identifications are displayed for all to see and examine on the Virtual Museum website; as a result, the members of the expert panels tend to err on the side of caution.
Let’s work our way through the seven groups. For each group of species, we will count the number of records submitted, and calculate the percentage which have been identified to species level. Each group is illustrated with a recently uploaded record from the Virtual Museum.
This is Opistophthalmus gigas. At this stage the scorpions only have scientific names. There is a great need to make them more accessible to everyone by allocating English common names! The photograph was taken by Luke Kemp in Namibia. The ScorpionMAP details are available at http://vmus.adu.org.za/?vm=ScorpionMAP-3490
Scorpions. We expected the scorpions to be tricky. But of the first 3,259 scorpions to be submitted to ScorpionMAP, 3,259 have been identified to species. That is an incredible 98.6%.
This is one of the “green lacewings”. It is identified to family Chrysopidae. To see more detail, go to LacewingMAP and look at http://vmus.adu.org.za/?vm=LacewingMAP-15501. This photograph was uploaded from Swaziland by Kate Braun. Mervyn Mansell comments: “Unfortunately it is not possible to identify any closer. It is quite difficult to distinguish between the various green lacewing species without a close examination of the wing venation and the male genitalia. The females of the different species are difficult to separate even if wing venation is clear. Some species are, however, characteristic and can be distinguished from photos, This is is possibly one of the members of the genus Chrysoperla”
Lacewings. We knew the lacewings would be really really difficult. For the “green lacewings”, the Chrysopidae, many species need to be dissected to identify them! In spite of the problems, Mervyn Mansell, the lacewing specialist, has identified 1,556 of the 2,380 records uploaded to LacewingMAP to species. That is a commendable 65.4%. Even for the green lacewings, the ID-to-species rate is 35%. That is far higher than Mervyn anticipated when LacewingMAP started.
The beautiful Common Moorhen was photographed today, 2 November 2018, and the photo immediately uploaded by Adriette Benade from near Alexander Bay in the Northern Cape, South Africa. The BirdPix record is permanently curated at http://vmus.adu.org.za/?vm=BirdPix-63485
Birds. 61,657 bird records have been submitted to BirdPix. 61,518 have been identified to species. That is 99.8%. That is the highest rate of all. BirdPix has the potential to make a huge contribution to the African Bird Atlas. Wherever you are in Africa, take photos of birds and upload them. The chances of the species being identified are overwhelming!
Frogs. The frogs are potentially difficult to identify from photographs. Sometimes the key ID features can only be seen if there is a series of photos from different angles. The number of records submitted is 8,221, of which 7,898 have been identified to species. That is 96.1%. Given the difficulties, that is remarkably high.
Reptiles. The number of sets of reptile photos uploaded to ReptileMAP is 19,980. Many species of reptile are cryptic, and identification involves counting scales, etc. So it is not self-evident that the rate of identification from photos will be large. But the success rate in the Virtual Museum is an astonishing 98.8%. 19,736 of the records have been have identified to species or subspecies level.
Ryan Tippett uploaded this exquisite Eastern Sorrel Copper. He took the photo in the Clocolan District of the Free State. It was the fourth record of this species from this grid cell. That sounds pretty boring. Until you grasp that it “refreshed” the most recent previous record, made in December 1995. That’s 23 years ago. Refreshing old records is incredibly important, because it provides evidence that a species still occurs at a site. Details of this record are at http://vmus.adu.org.za/?vm=LepiMAP-661549
Butterflies. The butterflies constitute the largest component of the Virtual Museum. There are 88,892 sets of up to three photographs. 95.3% have been identified to species or sub-species level. There are six families of butterflies, and four are unproblematic! 88% of the butterflies identified to family or genus level come from two families: the Lycaenidae (the blues and the coppers) and the Hesperiidae (the skippers). These are the two tricky families with lots of lookalike species.
Citizen Scientist Alan Manson has made a massive contribution to OdonataMAP, especially from KwaZulu-Natal. Once upon a time, he was a birder, but then he saw the light, and got hooked on the dragonflies and damselflies. He took this photograph of a Violet Dropwing near Komatipoort in Mpumalanga. Full details are at http:// http://vmus.adu.org.za/?vm=OdonataMAP-58739
Dragonflies and Damselflies (the Odonata). The OdonataMAP database is growing fast. It now consists of 56,039 records. This is another tricky group, in which identification depends on subtle features. In spite of this, the expert panel has identified 51,291 records to species level. That’s an amazing 91.5%.
Take home message. 95.6% success rate in identifying to species!
The take home message. The question we asked at the start was “How frequently can the species in the photograph be identified?” Across the seven groups of species considered here, by November 2018, a total of 240,428 records have been submitted to the Virtual Museum. That is almost a quarter of a million records. Of these, 229,927 have been identified by one of the expert panels to species (or subspecies) level. That is an impressive 95.6%. For six of the seven groups, the identification-to-species rate exceeds 90%. The lacewings get dragged down by the “green lacewings”. The take home message has to be that the value of a photo record to biodiversity mapping at the species level, as done by the Virtual Museum, is massive.