We will slowly work out way through projects and provinces! We have done BirdPix in the Western Cape.
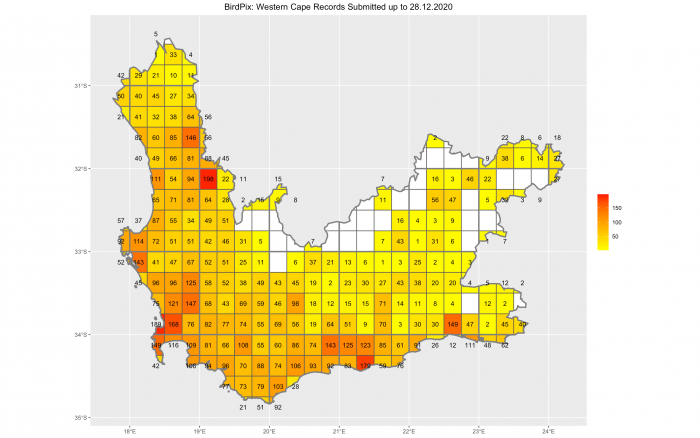
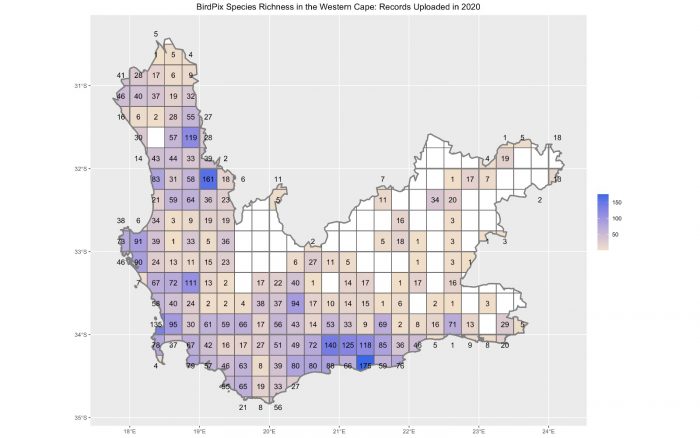
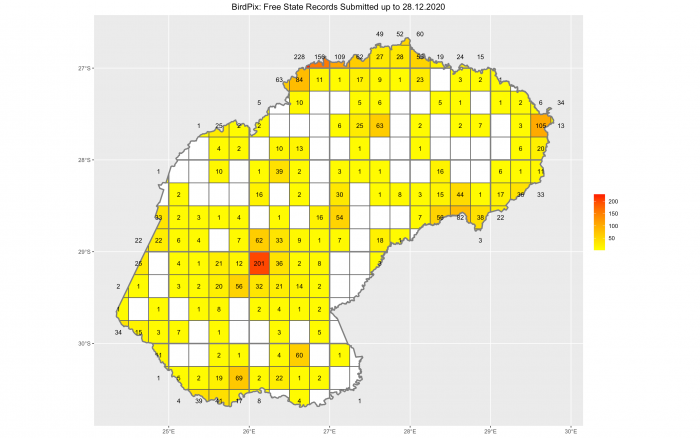
This map shows the number of bird species recorded for BirdPix in each quarter degree grid cell of the Free State at the end of 2020.
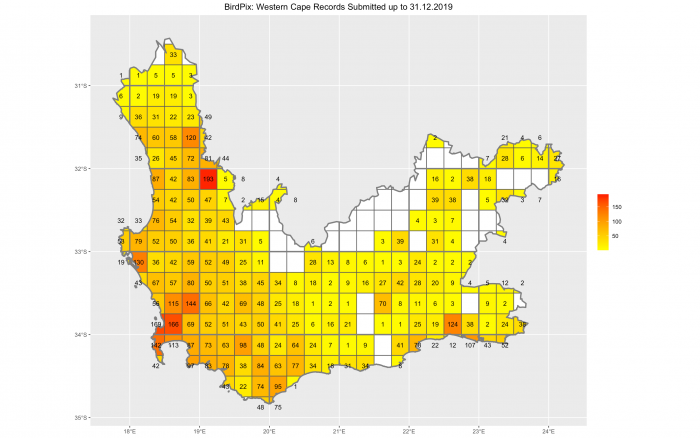
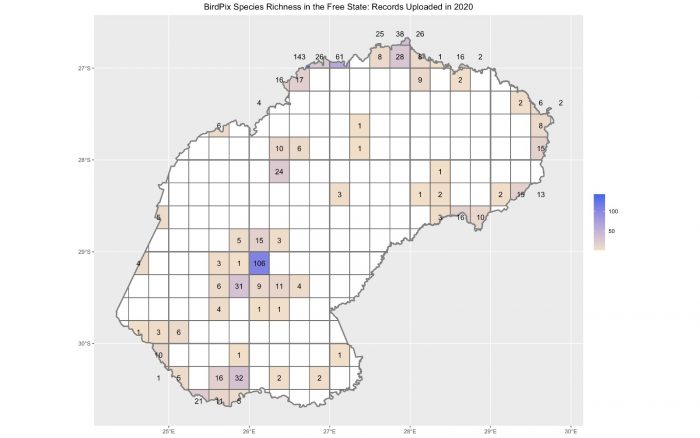
And this what this same map looked like a year ago, on 31 December 2019.
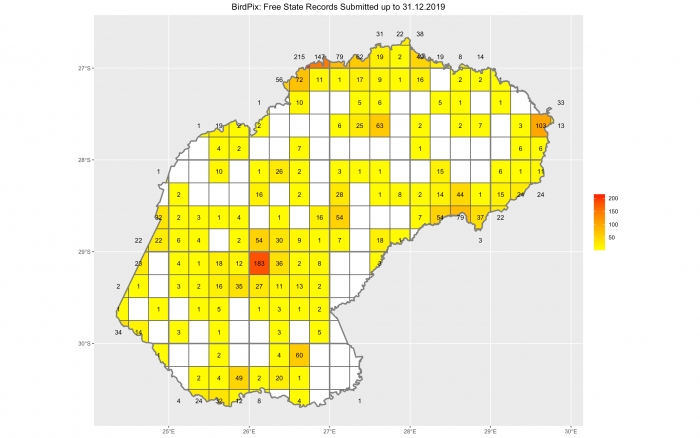
You have to work a little bit to see the advances. The number of bird species for Bloemfontein grid cell (2926AA near the centre of the map) increased by 18 from 183 to 201, and there have been lots of other increases. Seven grid cells got their first BirdPix records during 2020. The maps below provides a measure of BirdPix activity in the Free State during 2020.
So although the number of species in the Bloemfontein grid cell increased by 18, records were submitted for 106 species. That is precisely what we are looking for. The remaining 88 species were “refreshed“, in the sense that they now have records from 2020, confirming that they still occur in the grid cell.
It is this blue map which highlights the main focus of the Virtual Museum nowadays. The emphasis has shifted from “species per grid cell, irrespective of when the records were made”, to keeping the database “refreshed” and up-to-date.
Measuring “up-to-dateness” …
Here is another (and fairly subtle) approach to measuring “up-to-dateness” in the Free State overall! For each grid cell, we find the date of the last record for each species. If species are “refreshed” regularly, this date will be recent. We next sort all the “last recorded” dates for all the species in a grid cell from oldest to most recent. Calculate the date in the middle. Half the species were last seen before this date, and half have been seen subsequently. We want to keep this middle date as recent as possible. (Statisticians call this “middle date” the median, and there is a blog about this concept.)
Next, we take all the grid cells in a region (e.g. a province like the Free State) and we compute the middle dates (the medians) for all of them. We hope, on average, that these middle dates are pretty recent. To measure how recent they are overall, we calculate the middle date of all the middle dates in the region. We are happiest if this date is recent. We prefer this date to be recent, because if this median of medians is not too far in the past, it means that, overall, the species lists for the grid cells in the region are pretty up-to-date.
At the end of 2020, for BirdPix in the Free State, the median of the medians was 8 August 2016. In other words, half the grid cells had their own medians before this date, and half of them had medians after this date. August 2018 is four years and five months ago, or 53 months. So we can make the statement: at the end of 2020, BirdPix was, on average, 53 months behind the clock. We can repeat this arithmetic, pretending we are have turned the clock back to December 2019, a year ago. The median of the medians then would have been 9 September 2015, 52 months prior to December 2019. So, in terms of up-to-dateness, BirdPix in the Free State slipped by one month during 2020. Considering the difficulties of 2020, this is a satisfactory outcome.
As citizen scientists, we should aim to improve the up-to-dateness during 2021. We can achieve this by adopting the New Year’s resolution for Team Virtual Museum. “Starting in my home grid cell on 1 January 2021, I will upload records to the Virtual Museum of as many species as possible (and I will be especially careful not to neglect the common species). Wherever I travel in 2021, I will do my best to keep the distribution maps up-to-date for as many species as possible.” We should aim to do this wherever we are, and for all the projects of the Virtual Museum.
… more summary numbers …
At the end of 2020, there were 6,523 records in BirdPix which had been identified to species level. These included 425 bird species. The records were for 163 quarter degree grid cells. There are 153 grid cells which are entirely within the Free State, and another 85 which have overlaps between the Free State and other provinces or with Lesotho. That is a total of 238. So there are records for 163 of the 238 quarter degree grid cells in Lesotho. In the top map, the number of species recorded to date in each grid cell at the end of 2020 is given. If you add these numbers up, the total is 3,189 “species-grid cells”.
At the end of 2019, these figures were 5,524 records, for 418 species. So we added 999 records, and seven species in the year. During 2020, the number of grid cells with records increased by seven, from 156 to 163. The number of “species-grid cells” increased from 2,871 to 3,189, an increase 318. In other words, 318 species were recorded in grid cells from which they had not been recorded at the start of 2020.