

Since the 1980s, many migrant birds have arrived increasingly earlier in Europe in the northern hemisphere spring (March-April-May). This has often been attributed to springs in Europe gradually getting warmer. But this is obviously a wrong explanation. Long-distance migrants start their journeys thousands of kilometres from Europe. So they must be using different cues to initiate migration.
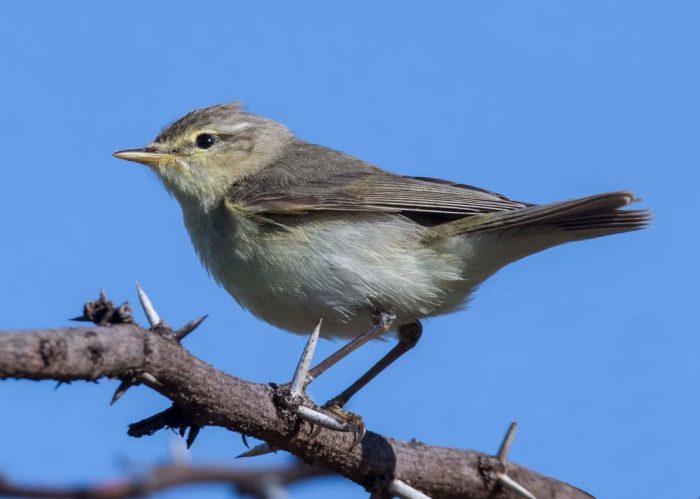
Magda Remisiewicz and I have written two papers in an Open Access journal called PeerJ which describes these cues for one long-distance migrant, Willow Warbler Phylloscopus trochilus. The big ideas are Magda’s. I helped with data analysis!
The story starts in Poland. With Professor Przemysław Busse. In 1960, as an undergraduate student in his early 20s, he grasped that, to study migration, you needed to have standardized sites and methods. Operation Baltic soon focused on three sites along the Polish coast of the Baltic Sea. The three sites all have the coast on one side, and waterbodies on the inland side, so migrants are funneled along quite narrow strips of land. The mistnetting is as standardized as possible, right down to the same number of nets used in the same places. Operation Baltic initially focused on autumn migration, between fixed dates every year, and later expanded to include fieldwork between specified dates in spring. Professor Busse’s legacy is one of the best long-term datasets for the study of migration patterns anywhere on the planet. In 1960, when he initiated Operation Baltic, no one had ideas about global climate change. So his database dates back to a pre-climate change era!

The paper discussed in this blog uses data from one of the three ringing stations, called Bukowo; this is the westernmost station and about 200 km from the border between Poland and Germany. Bukowo started operating in spring in 1982, so our paper uses data on the northwards migration of Willow Warblers since that year, and up to 2017. Every year the ringing station starts working on 23 March, and continues operating every day until 15 May. This covers the entire spring migration period for the long-distance migrants. It is usually early in April before the first Willow Warblers pass through. Any Willow Warblers mistnetted after 15 May are more likely to be birds that breed in the area than migrants. This is because the birds which have settled to breed locally keep on getting retrapped.


Back to the papers! The statistical analysis is quite complex, but the final results are easy to grasp. The first step is to estimate the “average cumulative arrival curve”, averaged across all the years of data. To find where to put the point for 1 May, say, add up all the Willow Wablers caught in all years on all days up to and including 1 May, and divide it by the grand total number of Willow Warblers trapped. This is the plot below. It shows, for example, that by 26 April, over all years, almost exactly 33% of the Willow Warblers have passed through Bukowo (see the lower of the two lines with arrows!).

Next we find the cumulative arrival curve for each year. The blue line in the plot below is for 2012. It shows that, by 26 April 2012, close on 70% of the year’s Willow Warblers had passed through. In other words migration was early in 2012. The area between the red line and the blue line is called the anomaly for 2012. Because the blue line is to the left of the red line, we gave the anomaly a negative sign. When migration is late, the blue line is to the right of the red line, and the anomaly is positive.

In the plot below, the dots represent the anomalies in each year, between 1982 and 2017. The dot for 2012 is the most negative of them all (which is why we used this year to illustrate the concept!).

When you look at the relationship between the annual anomaly and time, it is obvious that most of the anomalies in the early years were positive and in the final years were negative. In English, this means that the passage of migrating Willow Warblers is, on average, getting earlier. The statistical stuff top right says that a decreasing pattern like this is extremely unlikely to occur if the timing of migration is actually staying the same. In the jargon of statistics we talk about a trend of getting significantly earlier through the decades. But year is just a number. Even though the calendar year is correlated with the trend in the anomaly, it cannot be the direct cause of getting earlier.
And even if there is a trend, the annual anomalies do jump around a lot. Maybe there is something more going on. So we investigated whether any of the big climate indices could be used to “explain” the anomalies. In the map below, you can see the crazy things we tried. Working from the bottom to the top, we used the Southern Oscillation Index (SOI), the big climate index that drives El Niño, and influences rainfall throughout southern Africa, and is responsible for both droughts and floods. The Indian Ocean Dipole (IOD) is a poorly known index which influences rainfall in East Africa. Rainfall and temperature in the Sahel (TSAH, PSAH), just south of the Sahara Desert, are likely to be influential, because the Sahel is where a lot of the Willow Warblers from western Europe spend the non-breeding season. The Northern Atlantic Oscillation (NAO) is thought to explain whether or not conditions are good for spring migration. Temperature at Łeba, the closest weather station to Bukowo, were averaged for the migration period to form TLEB. We used the Scandinavian index (SCAND) from the previous summer as an explanatory variable for the anomaly in a given year, thinking that if it showed that conditions had been good/poor during the previous breeding season there would be more/fewer Willow Warblers on migration in the following spring!

In our first paper (it is Open Access Remisiewicz M, Underhill LG. 2020. Climatic variation in Africa and Europe has combined effects on timing of spring migration in a long-distance migrant Willow Warbler Phylloscopus trochilus. PeerJ 8(23):e8770) we developed a model which explained 59% of the variation in the overall annual anomaly. It had seven variables: Northern Atlantic Oscillation (over two three-month periods), Indian Ocean Dipole, Southern Oscillation Index, Sahel Precipitation Anomaly, Scandinavian Index and the local mean temperature at Łeba. The amazing thing is that if we add “year” as an eighth variable, the statistical model selection algorithm says that it doesn’t help to improve the quality of the explanation. This means that the combination of climate variables in our best model explained not only the year-to-year variation in the timing of Willow Warbler migration, but also the long-term trend for earlier migration. 59% might not sound impressive, but in this context it is pretty amazing.
Next step was to try something more ambitious. It was published in February 2022. Here is the link to the paper: Remisiewicz M, Underhill LG. 2022. Climate in Africa sequentially shapes spring passage of Willow Warbler Phylloscopus trochilus across the Baltic coast. PeerJ 10:e12964. There are lots of steps in the statistical story which are given in detail in the paper, but are glossed over here. But the series of plots below, which is one of the figures in the paper, shows how each of the climate variables sequentially impacts the anomaly during the migration period.
So, in each plot, the x-axis is essentially the spring migration season, 1 April to 15 May. The thickness of the band indicates the sequential impact of the climate variable on the anomaly. It is easiest to explain by doing an example. Plot A relates the Southern Oscillation Index, averaged over the period Aug-Oct in the year prior to migration. This variable tells us whether Willow Warblers arriving in southern Africa met good or bad conditions. Plot A is telling us that if the Willow Warblers arrived in southern Africa during environmental conditions, there anomaly is positive in the first half of the migration period. Lots of birds arriving early.

Plot B relates to the Indian Ocean Dipole, also Aug-Oct of the previous year. The graph shows that if the Indian Ocean Dipole has produced good rainfall when the Willow Warblers were arriving the previous year, then more birds pass through Bukowo in the early spring. Plots A and B, taken together, suggest that the Willow Warblers with wintering grounds in southern and eastern Africa occur at Bukowo are mainly in the early part of the migration period, and that they arrive there early after good rainfall in southern and eastern Africa.
Plots C and D relate to western Africa, to the conditions in the Sahel when the Willow Warblers are arriving there, Aug-Oct of the previous year. When conditions in the Sahel are good on arrival, they migrate through Bukowo early half a year later.
Plot E says that when conditions in the Sahel are good later on in the season, specifically if there is good precipitation (PSAH) from Nov-Mar, during the main non-breeding period, Willow Warblers from western Africa tend to be numerous on passage through Bukowo in the second half of the migration period. In other words, conditions remain good, so some birds take advantage of them, and delay migration by a week or two.
Plots F and G relate to the Northern Atlantic Oscillation. What the fairly uniform bars tell us if the conditions for migration in western Africa and southwestern Europe are good, there are more birds on passage throughout the migration season.
Plot H says that local temperatures do not play a role during the earliest part of migration. This implies that it is not local conditions which govern the timing of arrival of the first Willow Warblers at Bukowo. Instead, the start of passage is related to climate conditions in eastern and southern Africa several months earlier. Later in April and in May, if temperatures around Bukowo are high, there are more birds on passage.
And Plot I is particularly fascinating. The Scandinavian Index, from during the previous breeding season, points to conditions being favourable (or unfavourable) for high (or low) productivity. It makes sense that a good breeding season is followed by more birds on passage the following spring migration season.
In a nutshell, those are the main findings of our second Willow Warbler paper.
In these two papers in PeerJ, we used data up to 2017 (even though we had the Willow Warbler data for subsequent years!). We stopped then because 2017 was the final year for which one of the indices we were using was updated. We have found an alternative index, and have now done the analysis using the climate indices up to 2021. Firstly, the Willow Warbler’s trend for gradually earlier passage through Bukowo is continued. Second, and more important, the overall patterns are confirmed. Finally, and dangerously (because it is taking a chance to predict the future), we anticipate that the passage of Willow Warblers at Bukowo will be early this spring. We make this prediction because the current values of the Southern Oscillation Index have generated a wet summer in eastern part of South Africa. Conditions have been good for Willow Warblers and they are likely to migrate early! We will soon find out; the 2022 spring field season at the Operation Baltic ringing station at Bukowo is less than a month away.