This is the first of a series of blogs on BirdPix. This one covers the Western, Eastern and Northern Cape provinces of South Africa. For each province, it answers three questions: (1) How well is BirdPix doing overall? (2) How well has BirdPix done in the past year, since 1 April 2019? (3) When was each quarter degree grid cell last visited? We’ll tackle the remaining six provinces for BirdPix as separate blogs (KwaZulu-Natal and the five northern provinces) and then move on to other sections of the Virtual Museum.
Why is BirdPix so important? Right now, MSc student Karis Daniel is using the BirdPix maps to “model” the full distributions of species. All bird species, even the most common, have quite scruffy datasets. This is true to a greater or lesser extent for every species in the Virtual Museum. None of the maps is “complete”, there are lots of “false negatives”, places where the species MUST occur (because it is in most of the surrounding grid cells, which have similar habitat). We discussed “false negatives” here. In contrast, the distribution maps for the bird atlas, SABAP2, are virtually complete for many species. The bird atlas does not yet have full coverage, but there are lots of species for which the entire range is covered. The idea for Karis’s project is to use the statistical methods called “species distribution models” to generate complete maps out of the BirdPix data, and to find the method which comes closest to generating the “truth”, as defined by the bird atlas. If she can find a method that works for the BirdPix data, then we can apply it to the LepiMAP data, to the ReptileMAP data, to the FrogMAP data, to the ScorpionMAP data. All these projects have generated incomplete datasets, with lots of false negatives. The distributions are not complete.
What’s needed now for BirdPix is to get the database more comparable in size to that of, say, LepiMAP or OdonataMAP. There are three maps for each province. The first shows overall coverage, measured as species richness, the number of species recorded in the BirdPix database per quarter degree grid cell. The second map shows the total number of species recorded in the past year, from 1 April 2019 to 6 April 2020. This gives insight into how up to date the records are. The third map tells us when each grid cell was last visited. Let’s go.
Western Cape

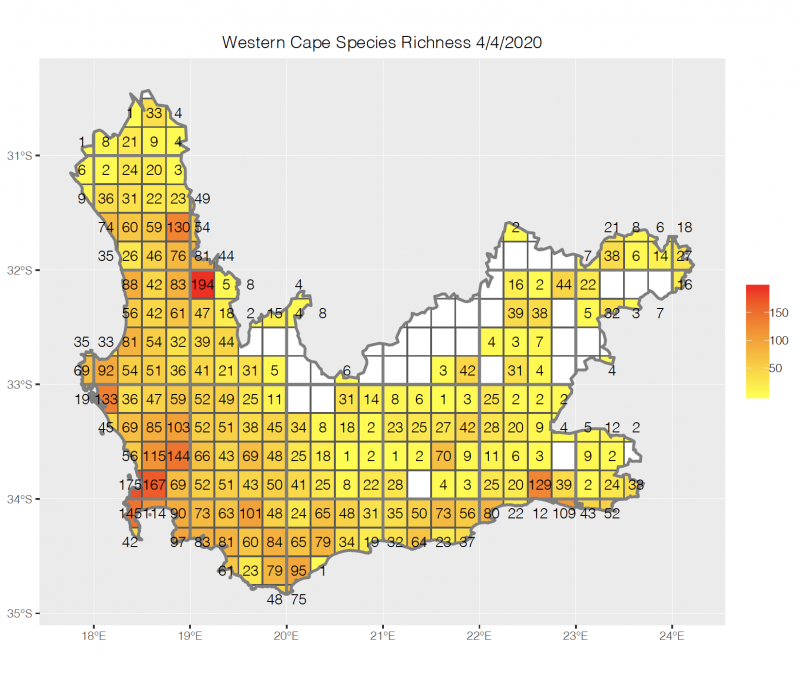
The grid cell in the Western Cape with the most species is 3219AA Clanwilliam. 194 species have been photographed here. The citizen scientist responsible for setting this bar so high is Zenobia van Dyk. If Zenobia can find 194 species in pretty difficult habitat mostly in the Cederberg Mountains, then the rest of us ought to be doing a lot better everywhere else. Even the Cape Town grid cell 3318CD, with the advantages of (a) habitat for seabirds, shorebirds and wetland birds, and (b) lots of observers, only has 175 species. [If you have difficulty going between the codes for the grid cells and the map, you need to study the blog on quarter degree grid cells carefully!]

This map shows the number of species recorded in each grid cell in the past year, since the beginning of April 2019. Many of the records were “refreshments” of old records. These are incredibly important, because they confirm the continued presence of a species in a grid cell. A very large number of the records made in this period were the first records in BirdPix for the species. This map is pretty impressive. And so is the next one …

All grid cells shaded dark blue have had at least one record submitted to BirdPix in 2020. And we are three months into the year. Those which are light blue have their most recent record from 2019. It is amazing that most grid cells with data have records from the past 15 months. The shades of greens and yellow (last visited 2013-2018), the pink grid cell (3320DA Kareevlakte, last visit in June 2012), and of course the blank grid cells are priorities for visits. But the overall impression for the Western Cape is how blue it is! Well done, BirdPixers.
Eastern Cape
We follow the same pattern as for the Western Cape.

Grid cell 3125CA, just south of Middelburg, has 202 BirdPix species. Tino Herselman is the citizen scientist responsible for the excellent coverage of this and the surrounding quarter degree grid cells. 3424BB has 175 species, the photographic handiwork of Desire and Gregg Darling; this grid cell contains Cape St Francis and the estuary of the Kromrivier. BirdPix needs some more champions in the Eastern Cape.

Grid cell 3324AD, which had 127 species in the previous map, has none in this map! Pam Kleiman, who was the BirdPixer here, has moved to grid cell 2929DA in the foothills of the Drakensberg in KwaZulu-Natal, where she continues to make an awesome contribution to BirdPix. We need someone in Steytlerville to take over Pam’s role, and keep the records for the grid cell refreshed and up-to-date.
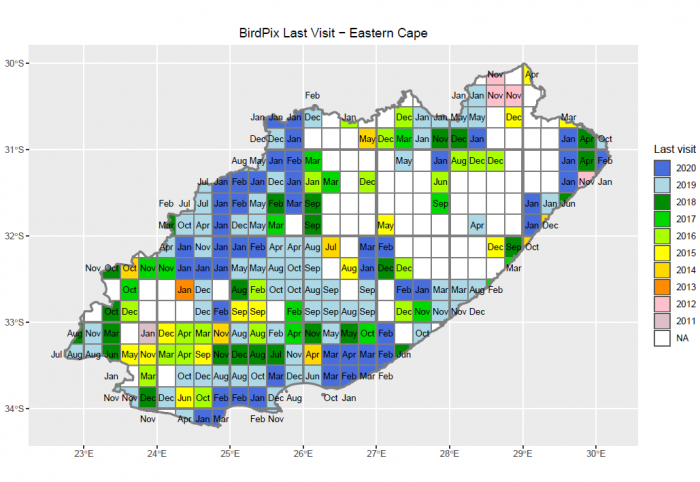
Please help keep this map blue, and preferably dark blue, by uploading your bird photos to the BirdPix section of the Virtual Museum. There is quite a lot of green and yellow at the western end of the Eastern Cape, and this is fixable. The eastern end of the Eastern Cape remains a big challenge for BirdPix, as it does for many citizen science projects.
Northern Cape
The Northern Cape is thinly populated. It is mostly arid, apart from narrow strips of riparian vegetation along the banks of the Orange and Vaal Rivers. Along sections of these rivers, there are also extensive irrigation schemes, which are green oases in semi-desert. For the past bunch of years, severe drought has impacted the province, heightening the contrast between the vast expanse of dryland and the tiny area of irrigated land. This is not an easy province to do citizen science in, and the temptation is to focus on the “green”. In arid grid cells, species richness is generally small, and especially so in the drought. Let’s have a peek and see how BirdPix has fared.

All things considered, coverage of the Northern Cape is not bad. There are some huge gaps, like the broad band of white running northeast from the northern corner of the Western Cape. Coverage in the southeast is good. This is where the Northern Cape touches Tino Herselman’s initiative in the Eastern Cape (see above). In this area is grid cell 3125AC, with 169 species, but it only has a sliver in the Northern Cape. So the grid cell entirely inside the Northern Cape with the most species is also in this area. 3024DC has 149 species. This grid cell contains the Karoo Gariep Nature Reserve, where the BDI Citizen Science Conference was held in February this year.
Two more prominent grid cells in the Northern Cape have resident citizen scientists. Altha Liebenberg is based in Danielskuil, in the northeast. 2823BA has 128 species. Ryan Tippett is on the farm Louievale north of Carnarvon, centre-south. 3022CA has 118 species. This demonstrates the incredible value of having dedicated citizen scientists based in grid cells. We desperately need more Althas and more Ryans!
We really do need the Virtual Museumers of Kimberley to focus their cameras on birds, and improve the BirdPix coverage. The city of Kimberley is split across four quarter degree grid cells: 2824DA has 16 species; 2824DB has 33; 2824DC has 22; and 2824DD also has 22. The initial target for each of these grid cells should be 100 species!
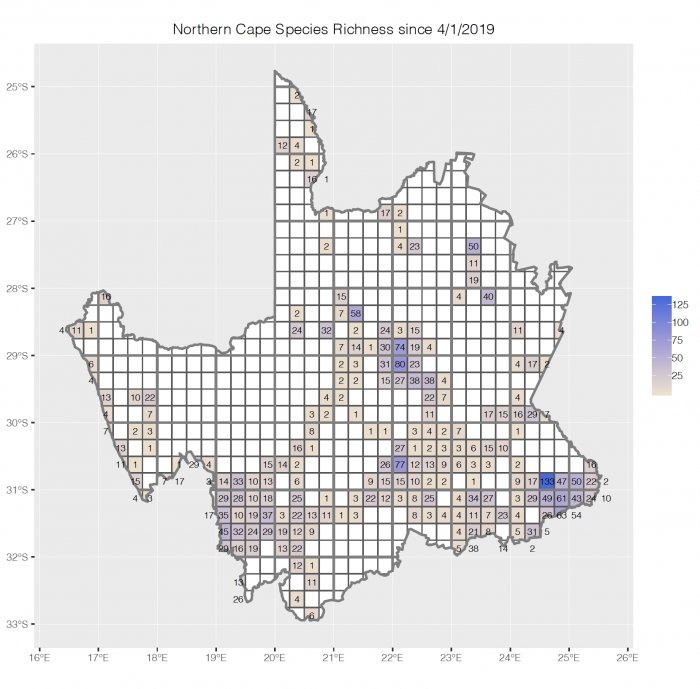
The visits by the BDI teams to the Karoo Gariep Nature Reserve in the past year (see here and here) generated 133 species in grid cell 3024DC. Two BioBashes have been held in the Northern Cape. The Calvinia BioBash in June 2019 is responsible for most of the records in the big rectangle in the southwest, and the Boegoeberg BioBash last October created the rectangle just east of centre. The Boegoeberg Dam lies in grid cell 2922AA with 80 species recorded in the past year; the total for the grid cell is 86 species, so there are only six species that have not been “refreshed”. The “caterpillar” of grid cells running northeastward from Calvinia towards Upington was created en route to the Boegoeberg BioBash, illustrating the value of the “road trip”.

It is impressive how much data collection for BirdPix has been done in 2019 and 2020. This map is mostly blue. Every record from the Northern Cape is precious, and this is true not only for BirdPix but for all the other citizen science projects.
The next blog in this series will focus on the five “northern provinces”: Limpopo, Mpumalanga, Gauteng, North West and Free State and the third one on KwaZulu-Natal.
Endnote: Quarter degree grid cells
The biggest barrier to interpreting these maps is getting to grips with finding your way around the six-character codes for the quarter degree grid cells. The clown who designed this complicated system should have been allowed to design one more thing only: his tombstone.
The first four characters are numbers, and tell us what degree cell we are in. Like reading a book, we start in the top-left corner, the northwest corner of the degree cell. The first pair of numbers are the degrees south and the second pair are degrees east. The degree cell below is 2830. The final two characters tell us the layout of the quarter degree grid cells within the degree square, as illustrated here.
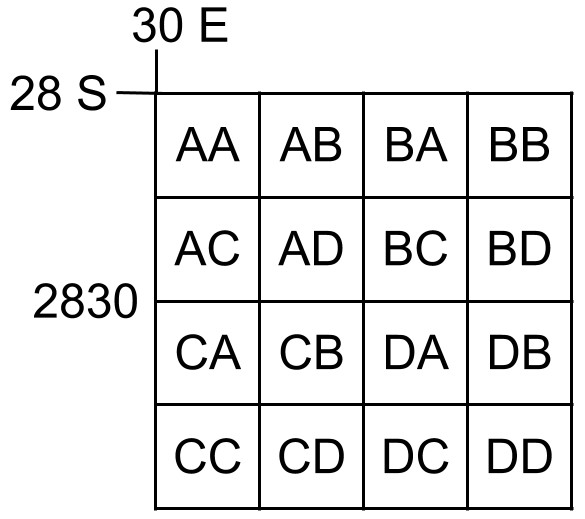
To find the code for a grid cell in the maps above, first step is to establish the degree cell. The degree lines are drawn thick. So it is mostly easy to navigate the degree cells. Go to the top left hand corner. Follow the line to the left edge of the map, and find the degrees south. From the top left corner of the degree cell, follow the line to the bottom edge of the map, and find the degrees east. That gives you the degree square. Within the degree square, the diagram above shows you the two-letter code for the quarter degree grid cell you want.
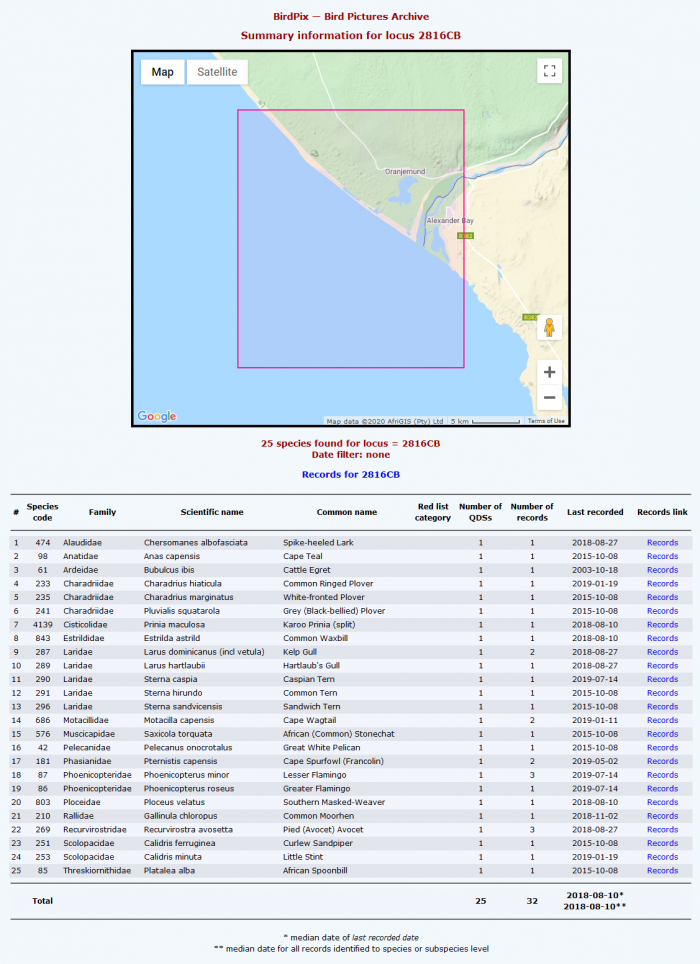
The web address for getting the list of species for a grid cell has this pattern: http://vmus.adu.org.za/vm_locus_map.php?vm=birdpix&locus=2824DD. You can change the “locus” (=the place) to the code for any other quarter degree grid cell. And if you want the reptiles rather than the birds, change vm=birdpix to vm=reptilemap. Suppose you want the birds from the quarter degree grid cell at the mouth of the Orange River, in the extreme west of the Northern Cape. On the map, go to the top-left corner of the degree cell. It is at 28S and 16E. So the grid cell is 2816. It is in the third row from the top, and the second row from the left. From the diagram above, this is position CB. So the code is 2816CB. So let’s try http://vmus.adu.org.za/vm_locus_map.php?vm=birdpix&locus=2816CB. That’s right, and here is the map and the list of 25 species which have been recorded here!
Thank you
Karis Daniel and Itxaso Quintana made the maps. Rene Navarro wrote the underlying query that enables these maps to be produced. Malcolm Robertson, Colin Summersgill, Lisl van Deventer and Garth Aiston do the major share of confirming identifications for BirdPix. Thank you.
