The Virtual Museum (populatrly known as the VM) provides the platform for citizen scientists to contribute to biodiversity research and mapping projects. This innovative concept was originally developed by the Animal Demography Unit at the University of Cape Town (UCT) in 2005. It is now managed by the Biodiversity and Development Institute (an independent non-profit company) and the FitzPatrick Institute of African Ornithology (UCT).
What is the Virtual Museum?
For many people, the word “museum” conjures up images of a place to see stuffed animals on display. But this museum is not like this. Every real museum does not only have displays; there is always a door labelled “Private: Staff Only.” Go through that door, and you get into the scientific part of the museum. If it is a biological museum, it consists of large collections of specimens. Frequently there are large numbers of specimens of the same species from different parts of the range. They are all carefully preserved and labelled with the date and place where they were collected, the name of the collector, and the associated number of the record in a catalogue, which until recently was on paper. This is a real museum below!

The Virtual Museum is just like this part of the Real Museum, except that instead of specimens on shelves or in bottles, we have digital photographs in a database. The details of collector, date and place are also in the database. For example, there are 3,488 photographs of Painted Ladies Vanessa cardui in LepiMAP, and here are a handful of them:

One important use of all these photographs of the Painted Lady is to plot the locations where each record was observed, and to make distribution maps. One standard way of making maps is to put a grid over the region of interest, and to shade the grid cells in which the species has been recorded. In South Africa, Lesotho and Eswatini we often use a coarse grid, with lines at quarter degree intervals, about 27 km apart. When you realise that this coarse system generates 2,000 quarter degree grid cells for these three countries, then 3,488 records is not so impressive. If we go to a one minute grid (about 1.6 km), which would be nice, the three countries have 450,000 grid cells, nearly half a million!
A second use of all these Painted Lady records is to use them to work out the period of the year when the species is flying. This is called the “phenology”. When people talk about climate change, the first thought is that the future will be warmer. Another component of climate change is that the timing of the seasons will change. There is a real interest in seeing how biodiversity adapts to these changes. The statistical methods used to produce phenology plots need mountains of data. 3,488 Painted Ladies is not enough! And if we are going to be able to detect changes in phenology, we need vast numbers of new photos of Painted Ladies, made in 2021, 2022, 2023, …. and for ever. We will never have enough Painted Ladies. It is just as well this museum is “virtual” rather than “real”!
Members of the public are encouraged to submit digital photographs for the various sections of the Virtual Museum. Together with the photograph goes the same information as on the label of the specimen. Species identifications can be done by the observers, and these are confirmed by a panel of experts. If there is no identification, then these are done by the expert panel.
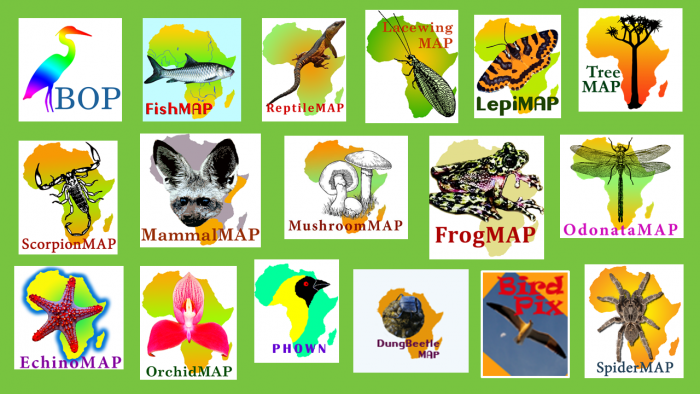
Currently the VM hosts 17 biodiversity projects: BirdPix (bird pictures archive); BOP (odd plumages of birds). PHOWN (photos of weaver nests), and 14 atlases: DungBeetleMAP (dung beetles, Coleoptera: Scarabaeidae). EchinoMAP (African Echinoderms: sea stars, sea urchins and brittle stars), FishMAP (freshwater fish in southern and eastern Africa), FrogMAP (African frogs), LacewingMAP (African Neuroptera and Megaloptera), MushroomMAP (South African mushrooms), OdonataMAP (African Odonata), OrchidMAP (African orchids), LepiMAP (African Lepidoptera), ReptileMAP (African reptiles), ScorpionMAP (African scorpions), SpiderMAP (African spiders), MammalMAP (African mammals), and TreeMAP (South African trees).
The databases in the Virtual Museum are used for multiple purposes. The most common use is to collate all the places where a species has been photographed, and to generate distribution maps for the species. These are available online and serve as conservation and education tools. These maps include Virtual Museum records and sometimes also other distributional records which are contained within the Virtual Museum database.
Virtual Museum records help expand the distribution databases for these taxa; they not only confirm the presence of a species at a particular point in time, but they also provide new distribution records for species and sometimes lead to extensions of the known range of a species. We try hard to “refresh” old records, so the maps are kept up to date.
Although the Virtual Museum database contains the exact localities of records, the only information made publicly available is the quarter-degree grid cell in which the record occurs. These are roughly square, with sides 27 km, about 700 square km. This is the scale at which information is published in atlases. For species that are subjected to poaching (e.g. rhinos, but a substantial list of other species as well), the records in the database appear to disappear as soon as they are identified. This is an unfortunate and important security feature of the Virtual Museum.
Your photos can make a difference for biodiversity conservation and information systems!