
BirdPix is important because it is going to be used to test whether “species distribution models” can be used to generate maps that look like the bird atlas maps from SABAP2. If we can get this right for the birds, then we can use the same statistical models for the dragonflies, the reptiles, the butterflies and everything else. It is only for birds that we can compile species lists for a place which are pretty comprehensive and complete within a few hours.
For example, for reptiles, good species lists for a locality are tough to get. There is a fascinating section in the reptile atlas for South Africa, Lesotho and eSwatini that describes 22 surveys, each at least 10 days long, which attempted to find all the reptiles at a site. See section 3.3.1 (pp. 4-6) in the reptile atlas for a description of all the search methods used, such as road-cruising at night, searching through leaf-litter, under rocks and sheets of corrugated iron, massive “trap arrays”, night-time spotlight surveys for sleeping chameleons, etc. And after 270 days of fieldwork, there was good data for 22 grid cells, out of more than 2000! So the maps in the reptile atlas (and in ReptileMAP in the Virtual Museum with another eight years of data) are full of holes. Here is the distribution map for the Cape Cobra:
Obviously, and sadly, this map for the Cape Cobra is stuffed full of “false negatives”. These are grid cells in which the species occurs, but in which it has never been recorded. Remember that this map is built with the reptile atlas as the base, so it includes all the museum specimens and literature records as well as the Virtual Museum records.
“Species distribution models” provide a statistical approach to dealing with this problem. They use an objective approach to filling in the gaps (which is better than just doing it “by eye”, which is the strategy used for the fieldguides!). There are dozens and dozens of models, which all give different answers. How do you tell which species distribution models work well? The answer is simple. You need to have maps which are the truth. And the bird atlas provides this. So if we can use the BirdPix data (which is still even scruffier and even fuller of false negatives than the the ReptileMAP data) to “model” the bird atlas data, we can test the various species distribution modelling techniques.
The BirdPix database is still a good deal smaller than those of LepiMAP, ReptileMAP, etc. So, without neglecting all the other groups of species in the Virtual Museum, we want to give BirdPix a boost in 2021. The maps below show how well we are doing. The red and yellow maps show how well we are doing overall, and the blue maps show how well we are doing in 2021. The numbers in the quarter degree grid cells in the red-yellow maps show the total number of species for each grid cell. The numbers in the blue maps show the number of species based on records submitted in 2021 (so this does include some older records, but this is an incentive to get recognition for submitting your old records!!).
We’ll start in KwaZulu-Natal, and go roughly clockwise through the provinces of South Africa (ie KwaZulu-Natal, then Eastern, Western and Northern Capes, North West, Free State, Limpopo, and finally Mpumalanga and Gauteng. For each province, the cumulative red-yellow map comes first, then the blue map for 2021. The explanation for the KwaZulu-Natal maps is detailed, so you should probably read this, and then skip straight to the province that interests you the most.

Overall, KwaZulu-Natal has BirdPix records from 155 of the 174 quarter degree grid cells that intersect with the province. 15 of the 19 with no records are easy to spot. The other four just have slivers in the province and are a challenge to find! The 27,176 records which have been identified to species have yielded 612 species. The number in a grid cells is the species richness of the grid cell. If you add the numbers of species in all the grid cells in this map, the total is 9,685. You can say 9,685 species-grid cells. Another way to think of this number is compiling a distribution map for each of the 612 species. The total number of grid cells which would be shaded is 9,685. If every species occurred in every grid cell, then the number of shaded grid cells would 612×174=106,488 species-grid cells. The truth is much less than this, but much more than the current 9,685!
For every one of the 155 grid cells with data, we have calculated the most recent date on which each species was recorded. We have sorted these, and chosen the middle date (which is officially called the median). This measures the “average age” of the data for the grid cell. Obviously we’d love every species to be represented by a recent record. This confirms that the species still persists there. We end up with a collection of 155 medians. To get a quick summary of them, we repeat the process. Sort them. Find the date in the middle. This provides a measure of the “up-to-dateness” of the BirdPix data for KwaZulu-Natal. The median of the medians for KwaZulu-Natal is 28 December 2017. That is 39 months ago. For half the grid cells, half the species were seen after 28 December 2017, and vice versa. That is the interpretation of this date. We can improve this date by replacing old records of a species in a grid cell with new ones. We call this refreshing the data.
That leads us to the next map, the blue one:

The blue maps use only records submitted in this year, 2021. The number in each grid cell is the number of species submitted for that grid cell since 1 January 2021. If we can make this blue map really good during 2021, then lots of species will have records in 2021, and this will drag the “up-to-dateness” closer to the present! 80 grid cells have been visited so far in 2021. The total of these 80 numbers is 1,709. In these 80 grid cells, the most recent record for 1,709 species has moved to 2021. The median date in these 80 grid cells has changed for the better. And this must pull the overall median closer to the present.
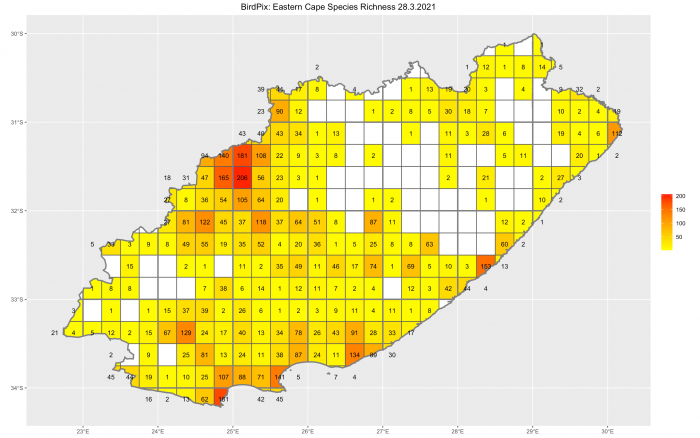
The Eastern Cape has BirdPix records from 238 of the 314 quarter degree grid cells that intersect with the province. 12,271 records have been identified to species. They have yielded 552 species. If you add the numbers of species in all the grid cells in this map, the total is 6,776 species-grid cells. The up-to-dateness of BirdPix in the Eastern Cape is 2 November 2017. That is 40 months ago. We can improve this date by replacing old records of a species in a grid cell with new ones. We need to keep refreshing the data.
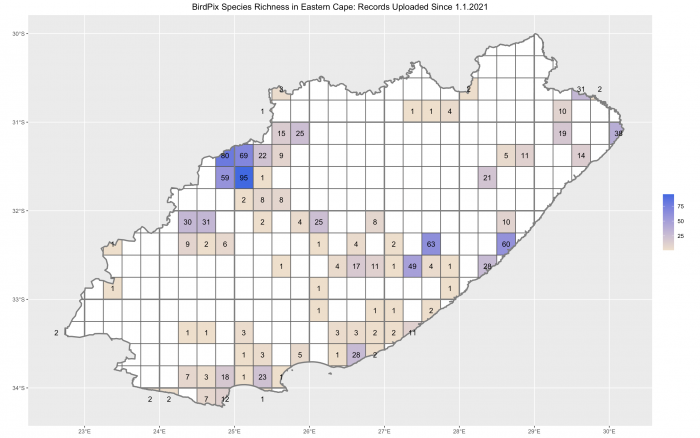
The blue map shows that 87 grid cells in the Eastern Cape have been visited so far in 2021. The total of the numbers of species in these 87 grid cells is 1,121 species-grid cells. The median dates in these 87 grid cells have changed for the better. This is the strategy to improve the up-to-dateness of the data. Get records for as many species as possible in 2021.
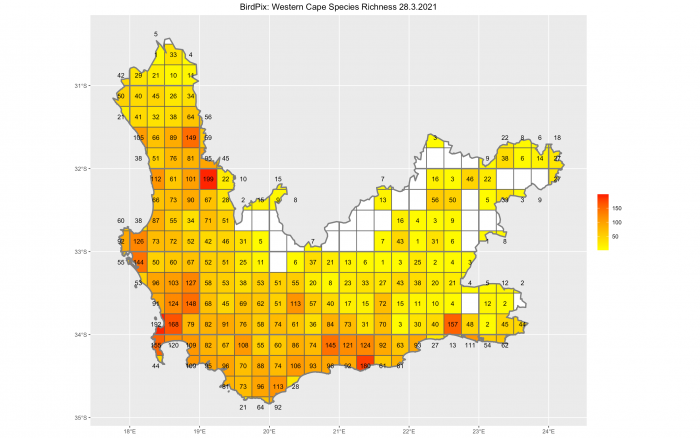
The Western Cape has BirdPix records from 226 of the 263 quarter degree grid cells that intersect with the province. 35,391 records have been identified to species. They have yielded 465 species. If you add the numbers of species in all the grid cells in this map, the total is 11,676 species-grid cells. The up-to-dateness of BirdPix in the Western Cape is 24 August 2019. That is 19 months ago. That’s excellent. To maintain this relatively recent date we are going to need to keep replacing old records of a species in a grid cell with new ones. We need to keep refreshing the data.
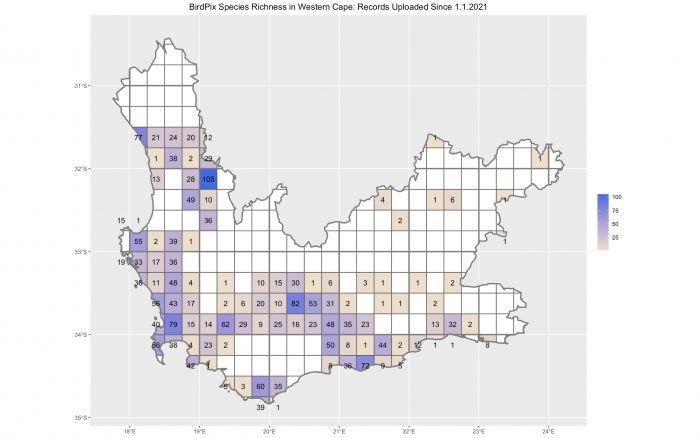
The blue map shows that 106 grid cells in the Western Cape have been visited so far in 2021. The total of the numbers of species in these 106 grid cells is 2,278 species-grid cells. The median dates in these 106 grid cells have changed for the better. This is the strategy to maintain the up-to-dateness of the data. Get records for as many species as possible in 2021.
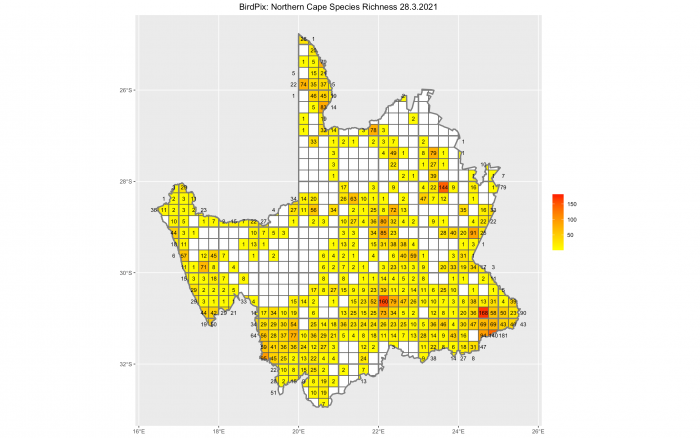
The Northern Cape has BirdPix records from 412 of the 654 quarter degree grid cells that intersect with the province. 15,327 records have been identified to species. They have yielded 412 species. If you add the numbers of species in all the grid cells in this map, the total is 8,486 species-grid cells. The up-to-dateness of BirdPix in the Northern Cape is 18 January 2019. That is 26 months ago. For a large and difficult province, this is remarkably good. To maintain this we are going to need to keep replacing old records of a species in a grid cell with new ones. There are 242 grid cells with no records at all. We need to try to reach these too!

The blue map shows that 90 grid cells in the Northern Cape have been visited so far in 2021. The total of the numbers of species in these 90 grid cells is 842 species-grid cells. The median dates in these 90 grid cells have changed for the better. This is the strategy to maintain the up-to-dateness of the data. Get records for as many species as possible in 2021 (and visiting new grid cells also helps!).
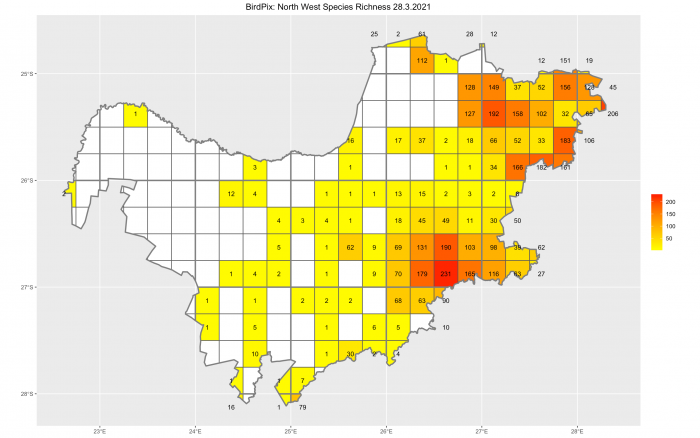
North West has BirdPix records from 113 of the 202 quarter degree grid cells that intersect with the province. 14,247 records have been identified to species. They have yielded 473 species. If you add the numbers of species in all the grid cells in this map, the total is 5,430 species-grid cells. The up-to-dateness of BirdPix in North West is 24 February 2017. That is 49 months ago. We can improve this date by replacing old records of a species in a grid cell with new ones. We need to keep refreshing the data.
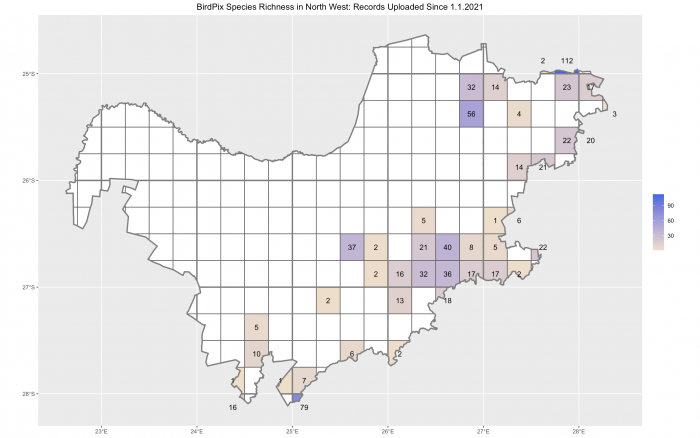
The blue map shows that 43 grid cells in North West have been visited so far in 2021. The total of the numbers of species in these 40 grid cells is 859 species-grid cells. The median dates in these 43 grid cells have changed for the better. This is the strategy to improve the up-to-dateness of the data for North West. Get records for as many species as possible in 2021.
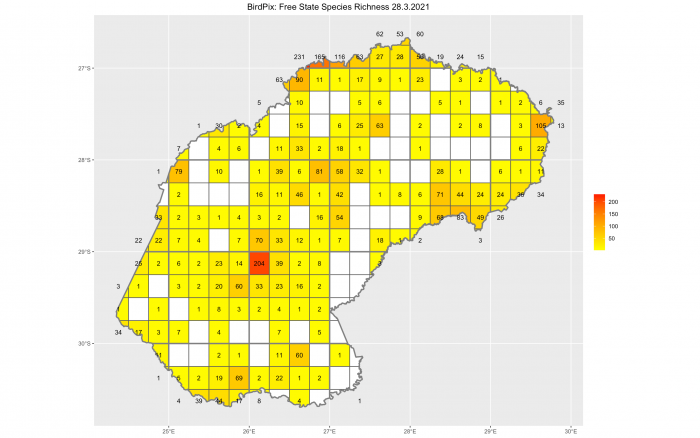
The Free State has BirdPix records from 176 of the 238 quarter degree grid cells that intersect with the province. 7,424 records have been identified to species. They have yielded 429 species. If you add the numbers of species in all the grid cells in this map, the total is 3,811 species-grid cells. The up-to-dateness of BirdPix in the Free State is 3 February 2018. That is 38 months ago. We can improve this date by replacing old records of a species in a grid cell with new ones. We need to keep refreshing the data.
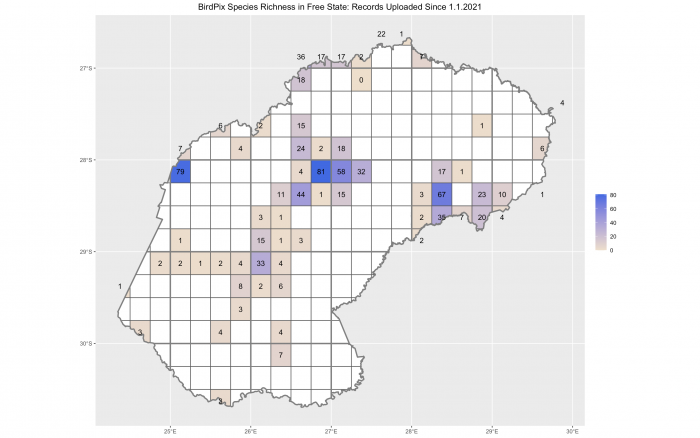
The blue map shows that 66 grid cells in the Free State have been visited so far in 2021. The total of the numbers of species in these 66 grid cells is 847 species-grid cells. The median dates in these 66 grid cells have changed for the better. This is the strategy to improve the up-to-dateness of the data for the Free State. Get records for as many species as possible in 2021.
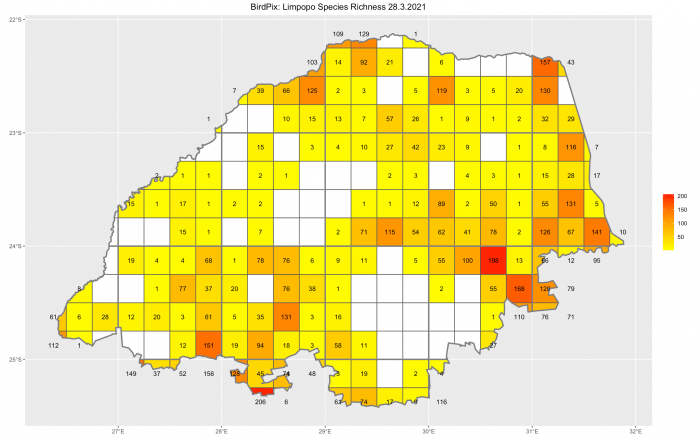
Limpopo has BirdPix records from 168 of the 221 quarter degree grid cells that intersect with the province. 14,670 records have been identified to species. They have yielded 561 species. If you add the numbers of species in all the grid cells in this map, the total is 6,790 species-grid cells. The up-to-dateness of BirdPix in Limpopo is 16 June 2016. That is 57 months ago, almost five years. We need a concerted effort in Limpopo to replace old records of a species in a grid cell with new ones.
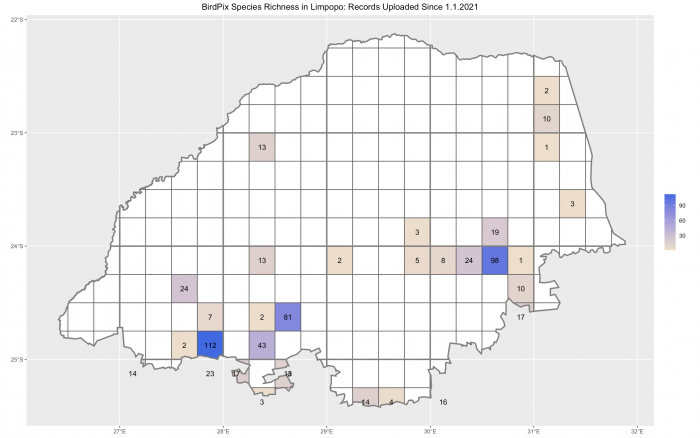
The blue map shows that 31 grid cells in Limpopo have been visited so far in 2021. The total of the numbers of species in these 31 grid cells is 656 species-grid cells. The median dates in these 31 grid cells have changed for the better. This is the strategy to improve the up-to-dateness of data for the Limpopo. A special effort is needed to get Limpopo up-to-date.
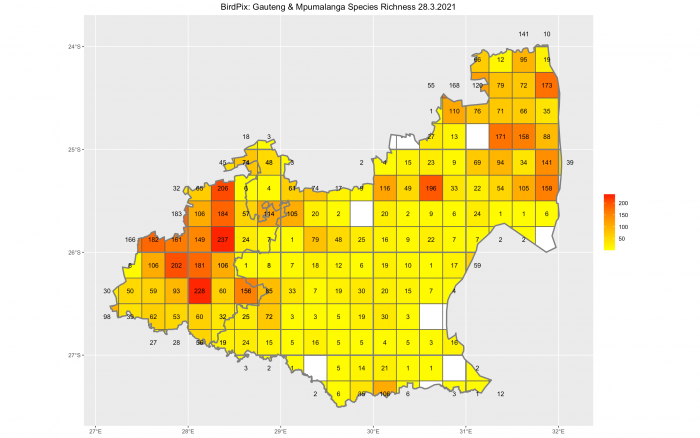
Mpumalanga has BirdPix records from 140 of the 157 quarter degree grid cells that intersect with the province. 11,892 records have been identified to species. They have yielded 547 species. If you add the numbers of species in all the grid cells in this map, the total is 5,325 species-grid cells. The up-to-dateness of BirdPix in Mpumalanga is 14 January 2017. That is 50 months ago. We can improve this date by replacing old records of a species in a grid cell with new ones. We need to keep refreshing the data.
Gauteng has BirdPix records from all 47 of the quarter degree grid cells that intersect with the province. 17,993 records have been identified to species. They have yielded 491 species. If you add the numbers of species in all the grid cells in this map, the total is 4,129 species-grid cells. The up-to-dateness of BirdPix in Gauteng is 23 August 2017. That is 43 months ago. We can improve this date by replacing old records of a species in a grid cell with new ones. We need to keep refreshing the data.
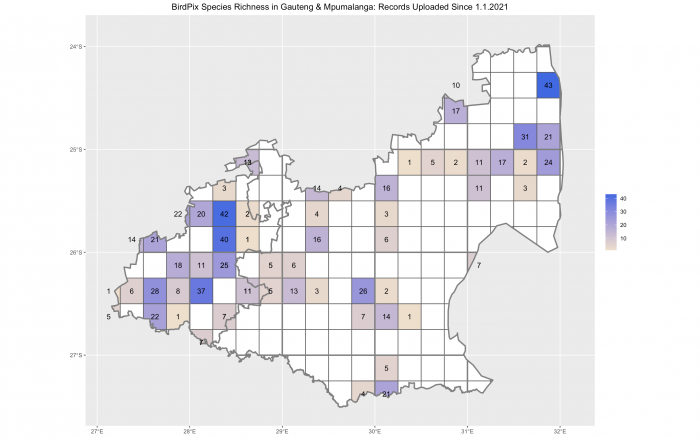
The blue map shows that 42 grid cells in Mpumalanga have been visited so far in 2021. The total of the numbers of species in these 42 grid cells is 535 species-grid cells. The median dates in these 42 grid cells have changed for the better. This is the strategy to improve the up-to-dateness of the data for Mpumalanga. A big drive is needed to get records for as many species as possible in this province in 2021
The blue map shows that only 27 of the 47 grid cells in Gauteng have been visited so far in 2021. The total of the numbers of species in these 27 grid cells is 458 species-grid cells. The median dates in these 27 grid cells have changed for the better. This is the strategy to improve the up-to-dateness of the data for Gauteng. A big drive is needed to get records for as many species as possible in this province in 2021.