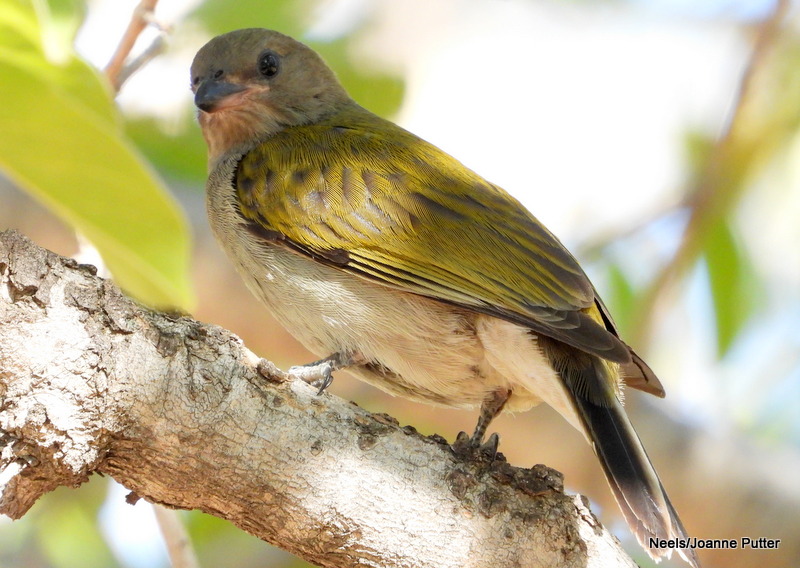
Lockdown started in South Africa on 27 March 2020. But the Virtual Museum kept going. During the first five weeks of lockdown, when we were largely confined to our homes, citizen scientists did two things: (1) they worked through their archives of old records, and uploaded them, and (2) they did the best they could to make new records in (and from!) their gardens. Pictures of raptors from gardens were the inspiration for this collage:
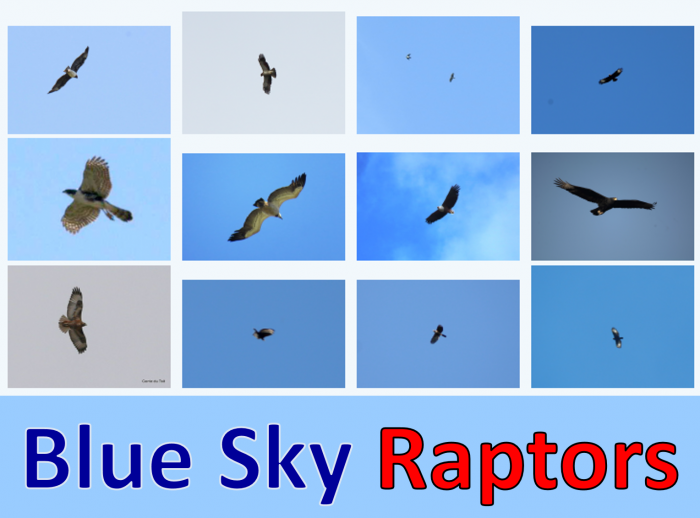
There were so many records of birds with blue sky in the background that we produced a blog: BirdPixing blues: look up and see birds.
Records for the Virtual Museum in general, and for BirdPix in particular, arrived from many African countries. BirdPix received 4,008 records for South Africa, increasing the size of the South African part of the database from 86,106 to 90,114 records. That’s a 4.7% increase for the period 27 March to 23 June. An impressive achievement, during a difficult period.
Since 27 March 2020, BirdPix has received records for 119 of the 1,974 quarter degree grid cells in South Africa. During the same period last year, 27 March to 23 June 2019, BirdPix got records from 346 quarter degree grid cells. So the restrictions on movement during the lockdown have had a massive impact on the number of grid cells visited. 119 is only 34% of 346! Not surprisingly, the total number of records has also decreased, but not by as much! 4008 is 71% of the 5,661 records submitted during the same period last year.
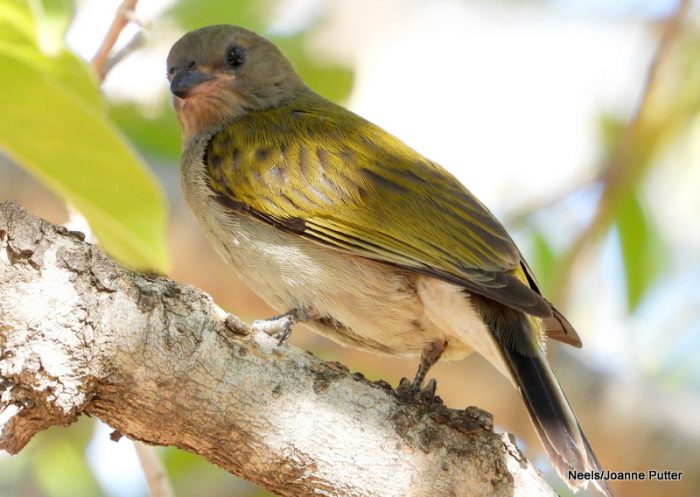
The quarter-degree grid cell with the most species added was 2427DD Mabula, close to Thabazimbi in Limpopo. Neels and Joanne Putter increased the species list by 65 species, from 20 to 85 species. They added 112 records during the lockdown period, for all of which the photos are new ones. You can see the list of 85 species (which is increasing regularly) by going to this website: http://vmus.adu.org.za/vm_locus_map.php?vm=birdpix&locus=2427DD. The Lesser Honeyguide below is their most recent addition to the grid cell.
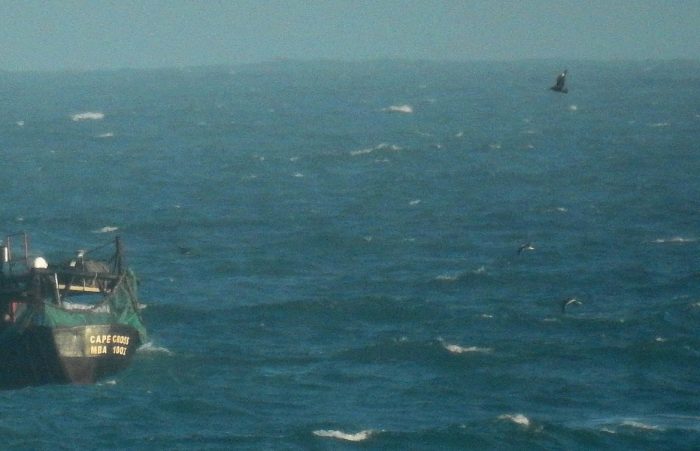
The grid cell with the most records added was 3421AD Stilbaai, on the coast of the Western Cape, a bit east of Cape Agulhas. Johan van Rooyen motivated the members of the U3A Stilbaai Bird Group to submit records to the Virtual Museum. The photo below shows a Subantarctic Skua at a fishing trawler far offshore of Stilbaai. This was one of 304 records which were submitted during this period.
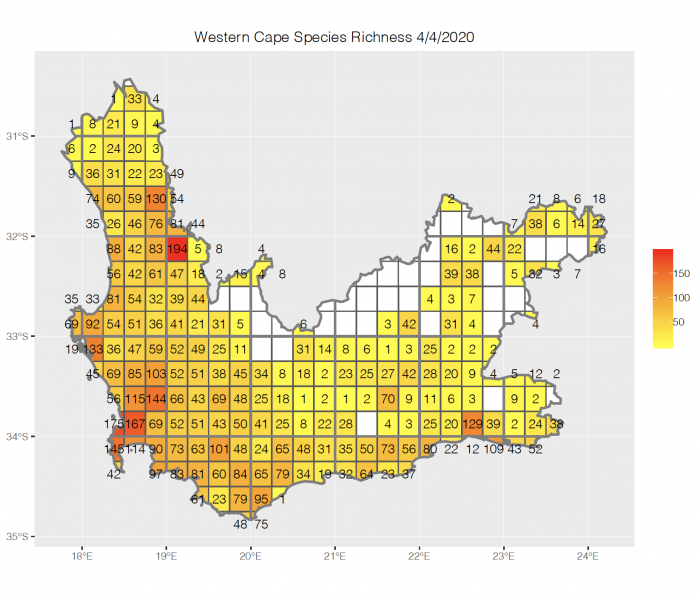
MSc student Karis Daniel produced a BirdPix coverage map for the Western Cape early in the lockdown period:
Karis made a repeat of this map on 22 June:
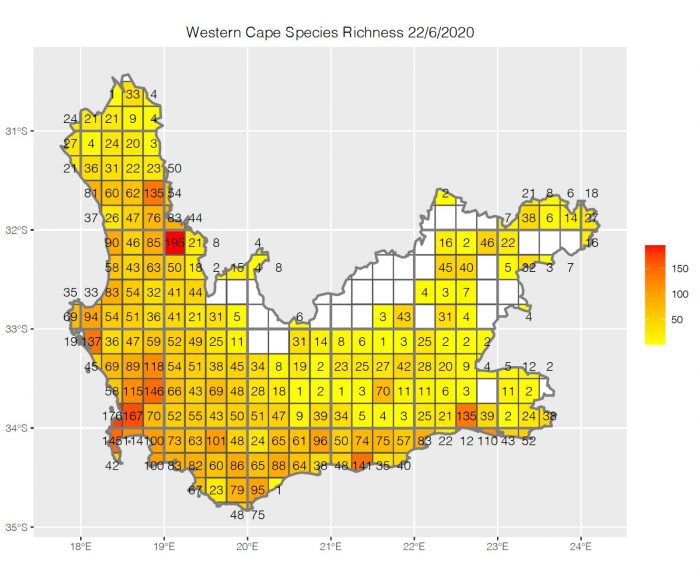
You need to do a bit of work to find the changes, but they are quite substantial. The most significant set of improvements is in the “northern arm” of the Western Cape. This is one of the priority areas in the province for increased coverage.
BirdPix is currently an important project. Karis is using the data to test “species distribution modelling” methods. She is using the BirdPix data, which is very sparse, to generate complete distribution maps, and comparing these maps with the SABAP2 maps. If we can get this right, then we can use the ReptileMAP, OdonataMAP, LepiMAP, etc, data to generate complete distribution maps for those groups. These maps will be at least suitable for use in the next generation of field guides for these species. The size of the BirdPix database is still smaller than for most other groups, so Karis is working at a disadvantage!
So please remember to take lots of bird photos this winter, and upload them to the BirdPix section of the Virtual Museum. This blog explains how to do it.

