Definition. The lowdown : the most important facts and information about something (Cambridge Dictionary). This blog summarizes the key results out of LepiMAP for the butterflies of KwaZulu-Natal and the Eastern Cape.
LepiMAP is the atlas of the Lepidoptera, both butterflies and moths, in Africa. It is one of the sections of the Virtual Museum. The first major output out of this database was the Conservation Assessment of Butterflies of South Africa, Lesotho and Swaziland. The development of this atlas is reviewed here. The butterfly atlas not only collected new distributional data using the Virtual Museum and dedicated field surveys, it also assembled the data for 300,000 records of specimens in museums and private collections. Some of the specimens were collected in the 19th century. The total number of records for this atlas was 337,000. This substantial database was the platform on which the LepiMAP initiative grew. The total size of the LepiMAP database on 15 April 2020 was 546,767 records, both butterflies and moths, throughout Africa.
This review is focuses on a small geographic component of the data, and only on the butterflies. This is the first of three blogs on the state of play in LepiMAP in South Africa. This one deals with KwaZulu-Natal and the Eastern Cape. The second with Western Cape, Northern Cape and the Free State, and the third with the remaining northern provinces of South Africa: North West, Limpopo, Mpumalanga and Gauteng.
LepiMAP is now using the updated taxonomy and the English common names in the second edition of Steve Woodhall’s Field Guide to the Butterflies of South Africa. The revision was published by Penguin Random House in March this year. It features the 671 species of butterflies which have been recorded in South Africa, Lesotho and Eswatini. The common names of the butterflies have been changed as part of an initiative to give butterflies more descriptive names (e.g. the area they fly in or the habitat that they prefer). The coppers (Aloeides) are now knowns as russets. The bars (Cigaritis) are now called silverlines.
KwaZulu-Natal

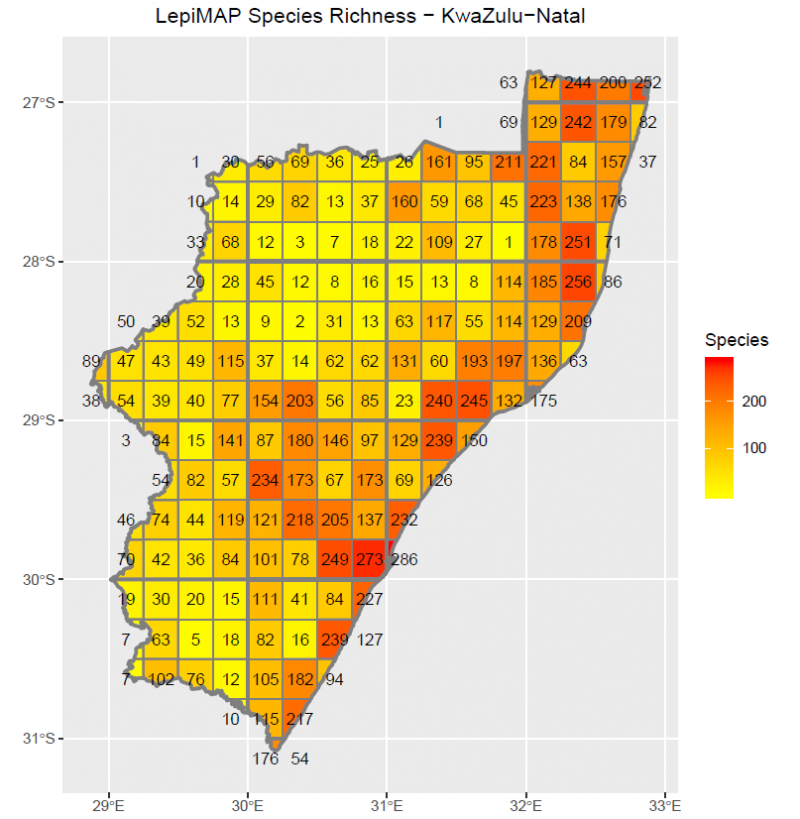
What is special about LepiMAP in KwaZulu-Natal is that every quarter degree grid cell has records of butterflies. That’s not quite right. There’s a grid cell with only one record and one species. It is grid cell 2731DD Ngxongwane. This record is of a Red-line Sapphire Iolaus sidus made by BW Plowes in January 1986. That’s 34 years ago! After the lockdown, someone needs to make a special effort to go to visit quarter-degree grid cell 2731DD Ngxongwane! It is not a long distance from the N2 as it heads northwestwards south of Eswatini.
The grid cell which seems to have the most species is 2931CC Durban East. An uncritical look at the database says that 286 species of butterfly have been recorded here. The oldest record in the database for this grid cell was made on 17 February 1854 by CGC Dickson. It’s an African Snout Libythea labdaca laius. Inside the database, in the part not open to public viewing, it says it this record was made at “Durban Morningside Burman Bush”, a locality that still persists to this day. This place description would have been linked to the actual specimen, so it is a genuine record of a species in this grid cell. The database has a total of 55 records for this species in this grid cell, made through the decades; the most recent was made by Jenny Norman on 22 March 2004, 16 years ago. African Snout needs to be refreshed.
This Durban East grid cell has an alleged total of 14,093 records of butterflies! The problem here is that there are a huge number of early museum specimens that are simply labelled “Durban” and have had their coordinates directed into this grid cell. The number of records for this grid cell since 1980 is 2,570. It would be a massively time consuming exercise to go through all the early records, and to try to work out which of the old records really came from this grid cell, and which came from somewhere in the general vicinity of “Durban”. Fortunately, this is serious problem only for this grid cell! 286 species here, even historically since 1854, is a bit of a stretch, even though it includes the bluff, the largely destroyed wetlands of Durban Bay and Durban North. See the map here.
Pride of place for the grid cell with the most butterfly records goes to 3030BC Scottburgh. It has 16,559 records; of these, 14,614 are photographic LepiMAP records uploaded via the Virtual Museum website. The photographic records stretch back to 2008, and have been contributed by citizen scientists such as Mary Lindsay, Christopher Small, Mark Liptrot, Luelle Watts, Trish Strachan, Christopher Willis and Garth Aiston. There must be a fantastic opportunity here to look at subtle changes in species composition through the past decade.

This map is quite alarmingly empty! Steve Woodhall admonishes LepiMAPpers: “For me, the take home message from this map is that we KZNers have become creatures of habit, going to our favourite spots month in month out!” The two grid cells towards the south with 159 and 138 species are 2930DD Durban West and 3030BC Scottsburgh, respectively. These have resident LepiMAPpers, and their long-term regular contributions are going to be amazing to search for trends. Two grid farther north have more than 100 species in the past year. Steve says: “2931AB Tugela (105 species) is high because of the popularity of Harold Johnson Nature Reserve, and in 2831CD Eshowe the popular spots are Dlinza and Mandawe. We need to move out.”

Many grid cells are dark blue or light blue, so that they have had records since 1 January 2019, especially along the coast on along the N3 axis towards the interior. But an inspection of the previous figure shows that, in many grid cells, just a handful of records have been made! There are two grid cells which are beige, so they have not had a single record this millennium!
Eastern Cape

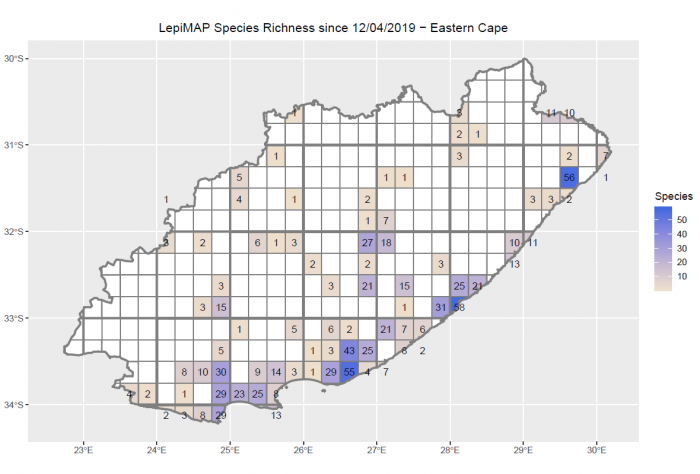
In the Eastern Cape, the grid cells having the largest species richness for butterflies are mainly along the coast and the coastal plain. The grid cell with the largest number of species, according to the database, is 3129DA Port St Johns. There are 5,315 records of butterflies allegedly from this grid cell, and 227 species. But 3,453 of these are prior to 1980. It is likely that this grid cell has the same problem is the Durban East grid cell mentioned above. The 1,862 records since 1980 represent 182 species, and it remains the most species rich grid cell in the Eastern Cape. Many museum specimens collected over a large area would have been labelled “Port St Johns”, which was once the largest town in the region.

Most records of butterflies submitted to LepiMAP from the Eastern Cape during the past year have been from coastal grid cells. It would be amazing to get a lot more records from all over the Eastern Cape!

There is a large number of grid cells shaded beige, and without a month. These have not been visited this millennium! There is lot of opportunity to make a major contribution to LepiMAP in all these grid cells.
Fanie Rautenbach does almost all the identifications of butterflies for LepiMAP. We asked him for his ideas on all these maps, for both provinces. He said: “I think these maps are very informative. The more you look at them the more information you see. However, they do highlight a major problem we have with LepiMAP. The project is doing well in a small number of sectors and doing not so well in the majority of sectors. I am especially surprised by the number of sectors in the Eastern Cape that have no records in the last 20 years. We really need to come up with ideas (1) to recruit more citizen scientists in the rural areas and (2) to encourage current citizen scientists to travel more.” If you are able to help, please do. The need is great.

