
The Virtual Museum had its BestYear ever in 2018, by a margin of 21%. The total for 2018 was 93,482 records. The totals for 2017 and 2016 were 75,408 and 73,104 respectively. That is a massive increase in 2018, conspicuously visible in the bar chart below.
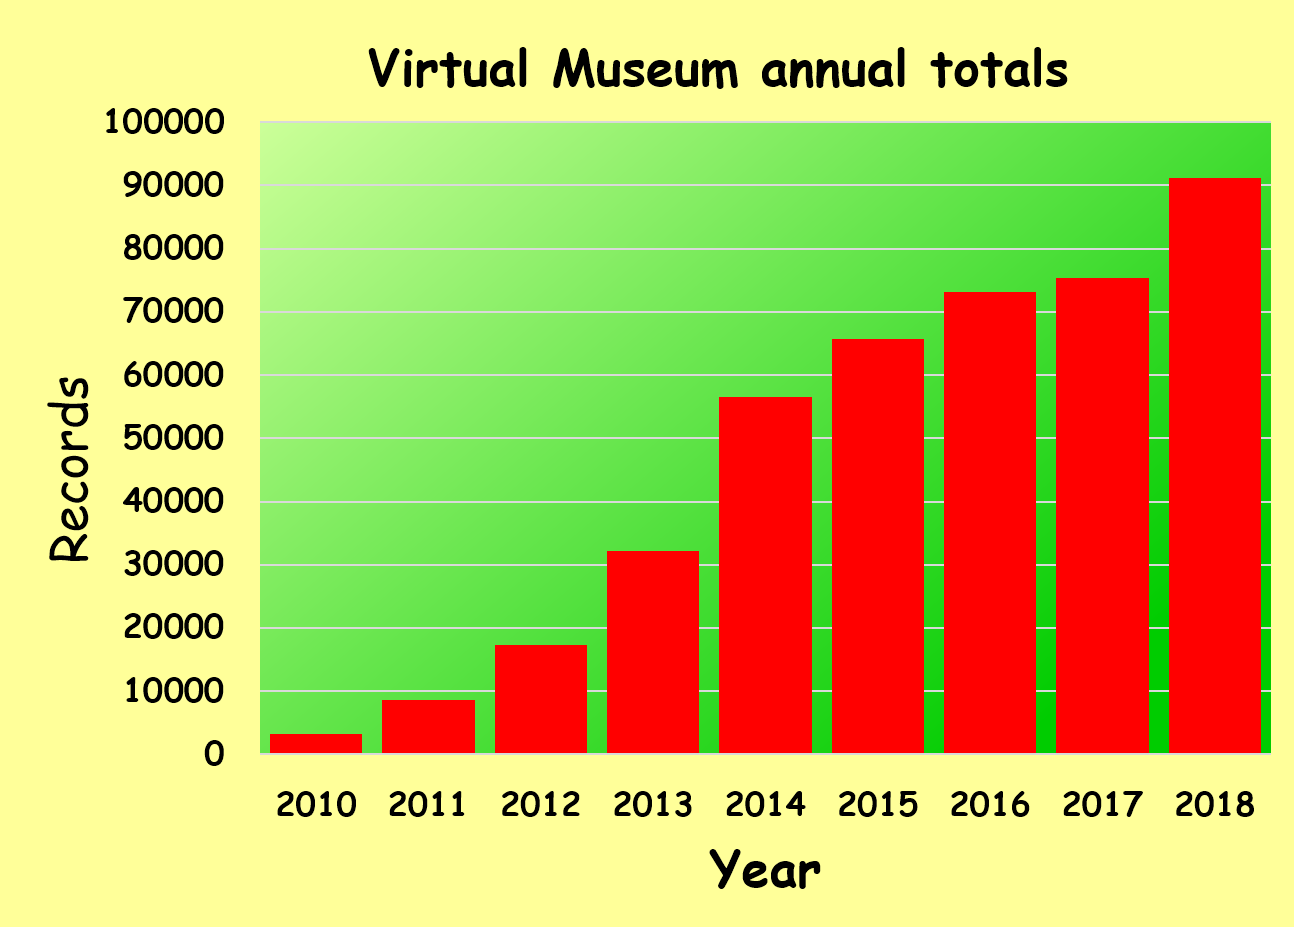
In theory, it is easy to count. Subtract the counter for the number of records submitted to the Virtual Museum at the end of a year from the counter at the end of the following year. This is pretty close, but it does not give quite the right answer. This is because sometimes the photograph(s) for a record contain more than one species, and the record needs to be duplicated. Sometimes there are duplicate records which need to be removed. The table below gives the correct number of records in each section of the Virtual Museum which were uploaded during 2018, as at 5 January 2019. For the first time, this total exceeds 90,000 records! By a large margin.

From the table above, three sections of the Virtual Museum received more than 10,000 records: LepiMAP got 29,077, OdonataMAP 21,373 and BirdPix 19,525. Another eight got more than a 1,000.
But poor old LacewingMAP only got 678 records! And 2018 was its BestYear. Before you dismiss this as irrelevant, you need to grasp the context! Mervyn Mansell, who does the identifications for LacewingMAP, is ecstatic about this number. One of the things he achieved during his career as entomologist was to assemble a database containing the details of almost every specimen of a lacewing, collected in Africa, and curated in a museum anywhere in the world. That entire database contains 12,898 records, collected since 1900. (Gosh, that is only 44% of the number submitted to LepiMAP last year.) So the 678 records of 2018 added 5.3% to the specimen database. That is huge. The best decade of specimen collecting of lacewings for museums was in the 1980s, when on average 345 per year were collected. The 2018 total of 678 is almost double that. This is amazing. Proportionately, LacewingMAP is one of the best performing sections of the Virtual Museum. Now you can understand why Mervyn Mansell is so enthusiastic about the contributions made by citizen scientists to LacewingMAP. You catch this enthusiasm from the tone of his comments in the caption to the photo below!

Similar stories can be written about many of the sections of the Virtual Museum, including many of the ones with relative small numbers of records submitted annually. and we will explore them in future blog posts. Citizen scientists are making a decisive contribution to understanding the current distributions of species, and how these are changing. This is critical information for all conservation initiatives.
This is the first of several blog posts about the Virtual Museum in 2018. We have, for example, asked members of the Expert Panels who do the identifications to tell us some of the records which impressed them the most in 2018. That is on its way. Enjoy.