

This is planned to be the first of many similar blogs. We are starting with an easy project, BirdPix, in my home province, Western Cape. It is still a bit experimental!
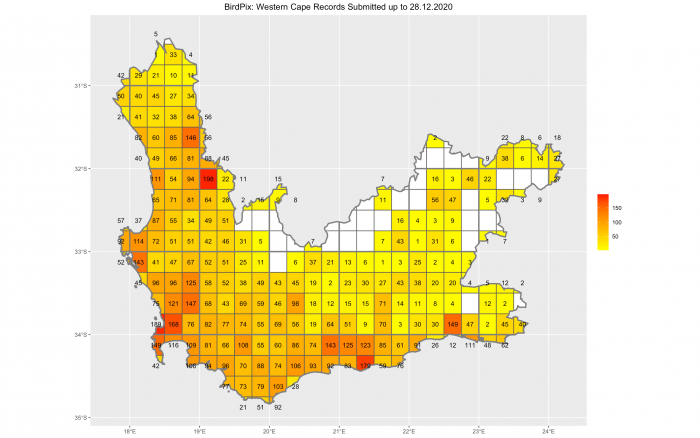
This map shows the number of bird species recorded for BirdPix in each quarter degree grid cell of the Western Cape on 28 December this year, very close to the end of 2020.
And this what this same map looked like a year ago, on 31 December 2019.
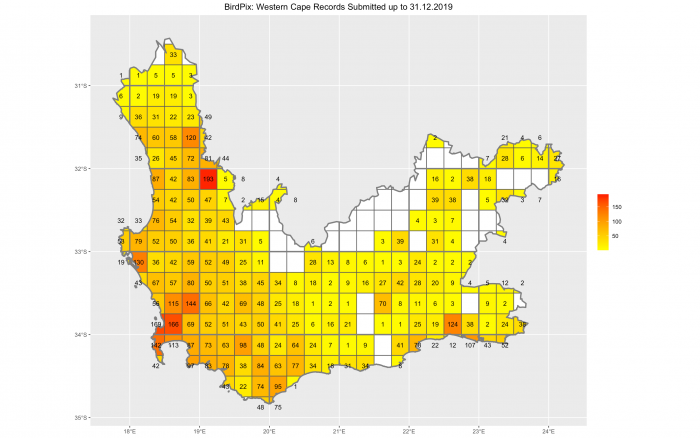
These two maps show impressive progress during 2020 for the total number of species in many grid cells. And you have to work quite hard to find the grid cells where the year-end totals are the same!
But the emphasis in the Virtual Museum has shifted from “species per grid cell, irrespective of when the records were made”, to keeping the database “refreshed”. The map below provides a quick measure of freshness. It shows the number of species per grid cell, for records uploaded in the year 2020.
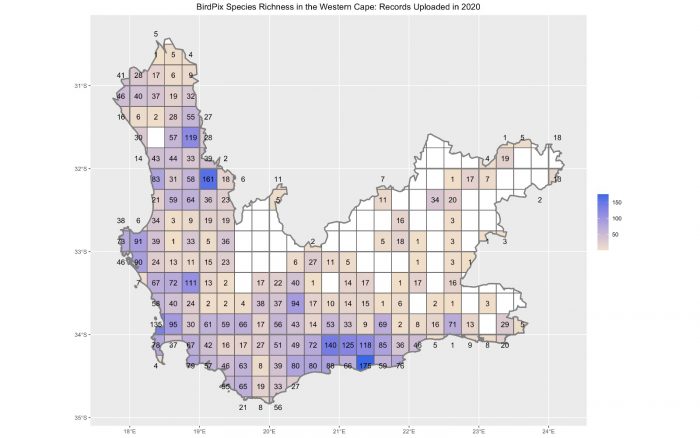
The logic here is that the more species uploaded for a grid cell in 2020, the more up-to-date the species list for that grid cell must be. We don’t know yet what this map will look like for other projects and for other provinces. But this has to be impressive! Some grid cells, those in darker shades of blue, had lots of species in 2020. Those with beige shades had only a few. But an awful lot of grid cells in the Western Cape were visited during the year.
The Cape Town grid cell had 169 species at the end of 2019 (second map). This had grown by 20 species to 189 at the end of 2020 (first map). But the total number of species submitted during 2020 was 135 (third map). This means that 20 of the 135 species were new to the grid cell, and that the remaining 115 species were used to do a 2020 refreshment of species last recorded in earlier years! This concept of “refreshing” old records is one that we are going to talk about more and more. There is a blog about this.
And here is a fairly subtle approach to measuring “up-to-dateness” in the Western Cape overall! For each grid cell, we find the date of the last record for each species. If species are “refreshed” regularly, this date will be recent. We next sort all the “last recorded” dates for all the species in a grid cell from oldest to most recent. Calculate the date in the middle. Half the species were last seen before this date, and half have been seen subsequently. We want to keep this middle date as recent as possible. (Statisticians call this “middle date” the median, and there is a blog about this concept.)
Next, we take all the grid cells in a region (e.g. a province like the Western Cape) and we compute the middle dates (the medians) for all of them. We hope, on average, that these middle dates are pretty recent. To measure how recent they are overall, we calculate the middle date of all the middle dates in the region. We are happiest if this date is recent. We prefer this date to be recent, because if this median of medians is not too far in the past, it means that, overall, the species lists for the grid cells in the region are pretty up-to-date.
At the end of 2020, for BirdPix in the Western Cape, the median of the medians is 24 October 2018. In other words, half the grid cells have their own medians before this date, and half of them have medians after this date. October 2018 is 26 months ago. So we can make the statement: BirdPix is, on average, 26 months behind the clock. Before we decide whether this is good or bad, we will need to do these calculations for lots of other projects and provinces. It will probably turn out to be awesomely excellent.
We can repeat this arithmetic, pretending we are have turned the clock back to December 2019, a year ago. The median of the medians was 14 December 2015. Gosh, this is 48 months previous to December 2019. In other words, at the end of 2019, BirdPix was 48 months behind the clock in the Western Cape. What this means is that, during 2020, BirdPix in the Western Cape “improved” from being 48 months behind the clock to being 26 months behind the clock. That is a 22-month improvement. That sounds pretty impressive.
New Year’s resolution for Team Virtual Museum
“Starting in my home grid cell on 1 January 2021, I will upload records to the Virtual Museum of as many species as possible (and I will be especially careful not to neglect the common species). Wherever I travel in 2021, I will do my best to keep the distribution maps up-to-date for as many species as possible.”

Postscript: Finding the ruddy quarter degree grid cells …
The frustrating thing about all these maps is this problem: “How do I find a particular grid cell on the ground?” Doing this is harder than it needs to be, because the clown who designed the system of codes for quarter degree grid cells ought to have been allowed to design only one more thing: his tombstone! It is a messy and unnecessarily complicated system. But we are stuck with it, so we have no choice but to get to grips with it. If you pick a grid cell in one of these maps, and want to work out its six character code, here is the recipe.
(1) Find the four digits for the one degree grid cell. To do this, first go up to the next thick line above your grid cell, and follow this line to the degrees number on the left edge of the map. In South Africa, there are always two digits. 33 is an example. They are the first two digits you need. Then go left from your chosen grid cell to the next thick line. The degrees number is on the bottom edge of the map. Also, two digits; numbers like 21. Run the four digits together. For the example above, the one degree grid cell is known as 3321.
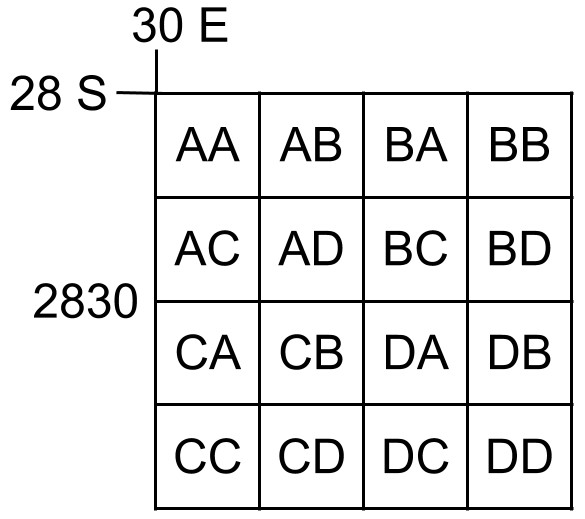
(2) There are 16 quarter degree grid cells in the one degree grid cell. They are arranged in four rows and four columns, and each quarter degree grid cell has a code consisting of two letters (see the pattern below). Which row and which column is your grid cell in? Suppose it is in the third row and the second column. Use this pattern guide to find the two letter code for the grid cell in this position. Third row, second column is position CB. Add these letters onto the four digits for the one degree grid cell. So the code for the grid cell you are looking for is 3321CB. Gosh, that is not easy.
To find a list of the bird species that have been submitted to BirdPix for grid cell 3321CB, go to http://vmus.adu.org.za/vm_locus_map.php?vm=birdpix&locus=3321CB. You will discover that it needs a visit!
You can put any grid cell you need as the locus (ie adjust locus=3321CB to whatever you need). You can also change projects; eg replace vm=birdpix by vm=reptilemap to get a list of reptiles for any quarter degree grid cell.