OdonataMAP is the Odonata Atlas of Africa. OdonataMAP is one of the sections of the Virtual Museum. From September 2020, the project has been hosted jointly by the FitzPatrick Institute and the Biodiversity and Development Institute (BDI). Major aspects of the OdonataMAP project are funded by the JRS Biodiversity Foundation through a grant that is administered by the Freshwater Research Centre. The Freshwater Research Centre has a JRS Biodiversity Foundation grant for developing a Freshwater Biodiversity Information System (FBIS) which will integrate the OdonataMAP data into its systems. The JRS Biodiversity Foundation has made a huge contribution to making biodiversity data accessible to policymakers, conservation managers and researchers.
94,000 records have been uploaded to OdonataMAP through the Virtual Museum website. Of these 82,000 (70%) have been uploaded since the beginning of 2015. That is about 15,000 photo records of dragonflies and damselflies per year. Identifications in OdonataMAP are done by an expert panel.
These 94,000 records are supplemented by 121,000 records from the ADDO database, the Odonata Database for Africa. This database was compiled by K-D Dijkstra and team, funded between 2012 and 2016 by the JRS Biodiversity Foundation. When the OdonataMAP and ADDO databases are combined, the total number of records is 215,000. This is one of the largest databases of its kind, globally.
The first Citizen Science Week of the 2020/2021 season starts this Saturday 19 September 2020, and runs to the end of the following weekend, Sunday 27 September. It’s a nine-day week! The objective of the Citizen Science Weeks is to improve the quality of the distribution maps for all the species covered by the Virtual Museum, throughout Africa. There will be a Citizen Science Week every month.
This blog shows the “state of play” with OdonataMAP on 17 September 2020. This month, the focus is on South Africa.
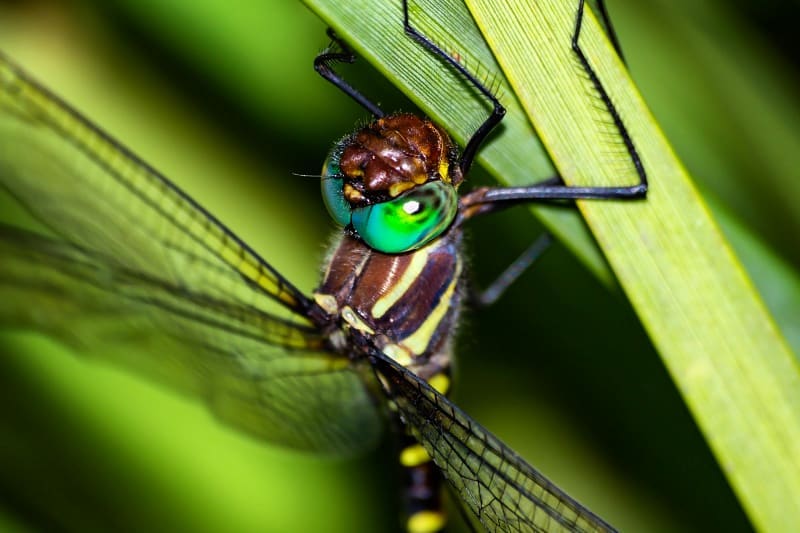
OdonataMAP gives everyone in Africa the opportunity to contribute to the Odonata Atlas of Africa. In order to participate all you need to do to contribute is to take photos of dragonflies and damselflies. Here is guidance on how to “shoot your dragons!”. Upload the photos to the OdonataMAP section of the Virtual Museum. Here is guidance on how to upload photos to the Virtual Museum. Members of the expert panel will do their best to identify the dragonfly or damselfly in the photo(s). There can be one, two or three photos for a single record; if you can, try to take the photos from different angles. This helps the expert panel.
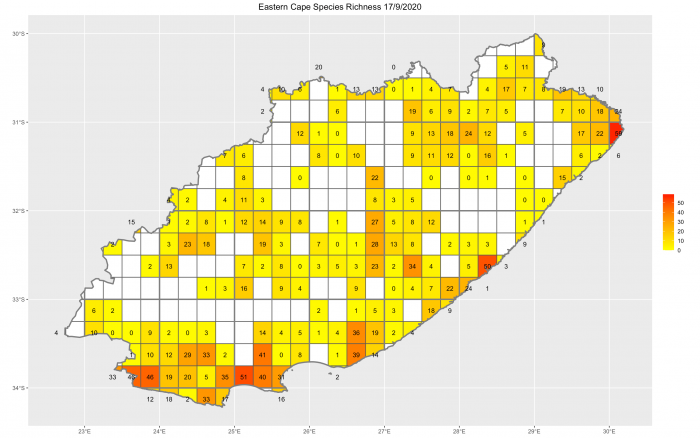
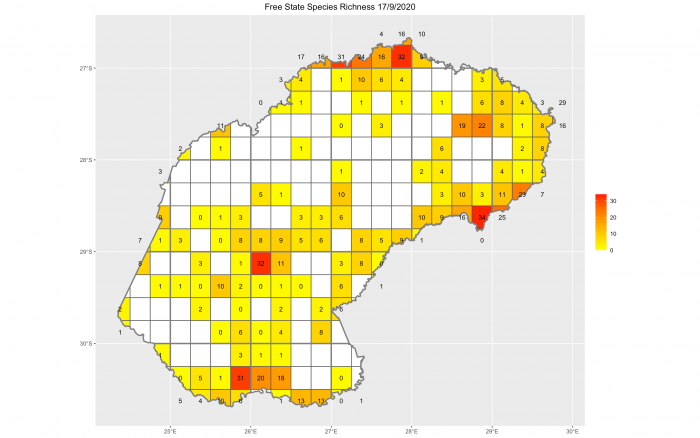
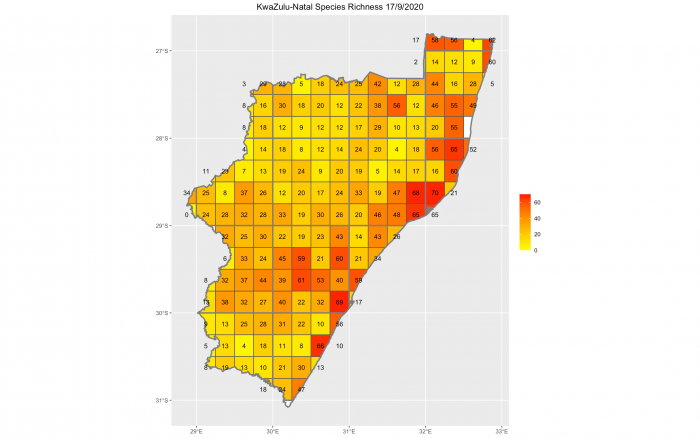
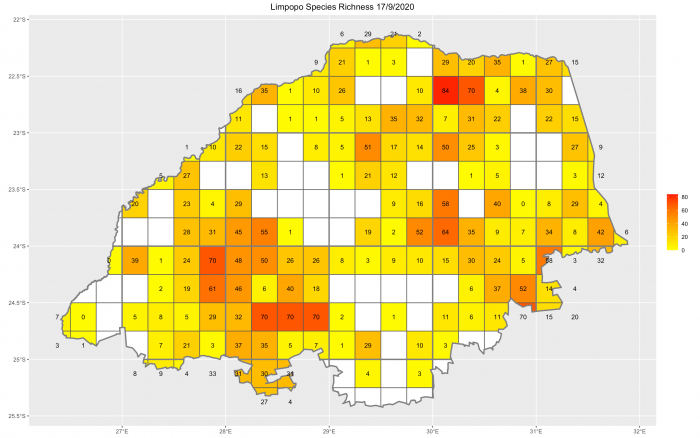
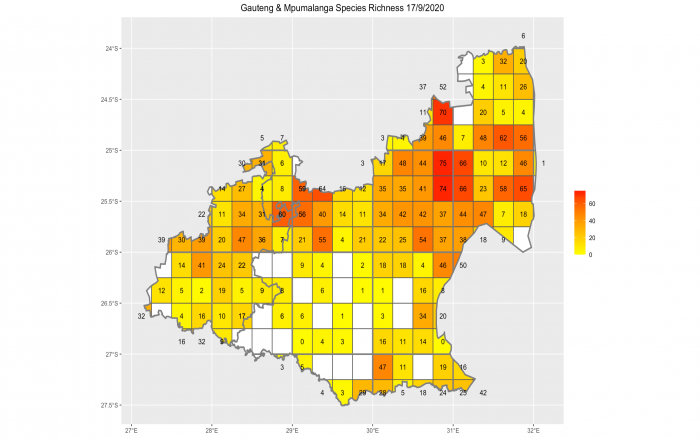
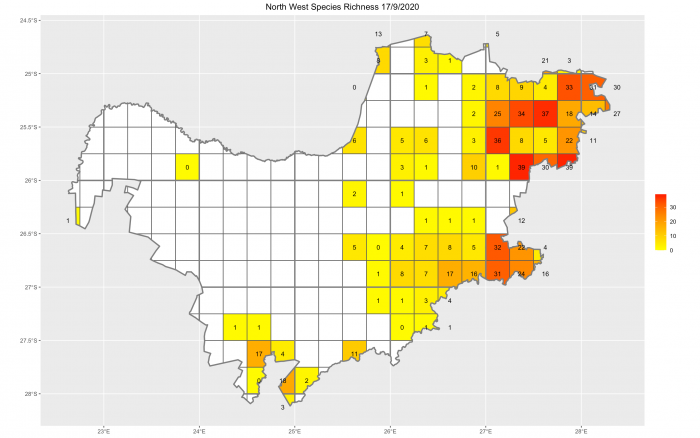
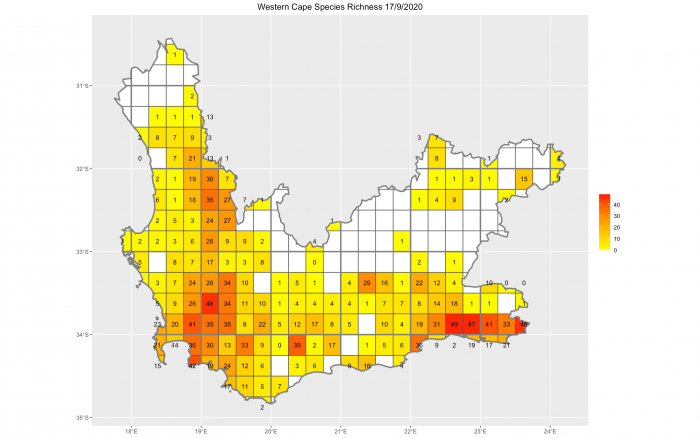
Below are the OdonataMAP species richness maps for each of the provinces of South Africa. The number in each quarter degree grid cell is the number of species recorded in that grid cell so far. The grid cells with at least one species are shaded. The yellower the grid cell, the fewer species recorded in it. The aim is to first of all turn the grid cell from white to yellow, and then to shift it along the yellow-red axis until it turns bright red. The yellow to red scales vary between provinces; if the scale used for KwaZulu-Natal was applied to the Northern Cape, the latter province would be almost entirely yellow!If a grid cell has a zero in it, this means that none of the records submitted for the grid cell could be identified to species level.
We will work through the provinces in alphabetical order, starting with the Eastern Cape and ending with the Western Cape. There is a single map for Gauteng and Mpumalanga, presented after the map for Limpopo.
Before we wrote this blog, we sent these coverage maps to John Wilkinson who leads the expert panel for OdonataMAP. His comments: “It is exciting to see the species counts increasing in a lot of quarter degree grid cells. This is the result of more citizen scientists contributing but also of regular visits to the same area right through the year. The coverage map for KwaZulu-Natal is the example we should strive towards in all provinces. I know that it is Alan Manson who is mostly responsible for this superb coverage, but in recent years Ryan Tippet, Richard Johnstone, Diana Russel and many others have contributed huge numbers of records. They have both refreshed old records and made range extensions.”
John is 100% right. We should strive to make all the provinces comparable with KwaZulu-Natal.