Lerm RE, and Underhill LG. 2019. Bird distribution dynamics – African black oystercatcher in South Africa. Biodiversity Observations 10.3:1-7
Biodiversity Observations is an open access electronic journal published by the Animal Demography Unit at the University of Cape Town. This HTML version of this manuscript is hosted by the Biodiversity and Development Institute. Further details for this manuscript can be found at the journal page, and the manuscript page, along with the original PDF.
Bird distribution dynamics – African black oystercatcher in South Africa
Rion E Lerm*
South African Environmental Observation Network, Phalaborwa, South AfricaLes G Underhill
Animal Demography Unit, Department of Biological Sciences, University of Cape Town, Rondebosch, South AfricaIntroduction
The objective of this series of papers on bird distribution dynamics in Biodiversity Observations is to report on the ranges of bird species as revealed by the Second Southern African Bird Atlas Project (SABAP2, 2007 onwards) and to describe how their ranges have changed since the first bird atlas (SABAP1, mainly 1987-1991), about two decades apart.
This series of papers is also made feasible by the development of two new standards for the presentation of maps, firstly pentad-scale distribution maps derived from SABAP2 data, and secondly range-change maps showing how distributions have changed between SABAP1 and SABAP2 (Underhill & Brooks 2016a, b). Because the papers in this series use these two new interpretations in the form of maps, the rules for interpretation are not provided in detail in each of the “bird distribution dynamics” paper series.
Introduction to the oystercatchers
Of the 9 extant oystercatcher species, two (22%) fall under Red list categories other than ‘Least Concern’. The Eurasian oystercatcher Haematopus ostralegus is considered ‘Near-threatened’ globally. The Chatham oystercatcher Haematopus chathamensis however, is considered globally ‘Endangered’. The latter species has significantly increased over the last 20 years, possibly owing to intensive conservation efforts. However, even on islands free from mammalian predators, population sizes fluctuate, with numbers on one island undergoing a possible long-term decline (BirdLife International 2018a). A single oystercatcher species (Canarian oystercacther Haematopus meadewaldoi) that was endemic to the Canary Islands, is now considered ‘Extinct’. There, a last specimen collection took place in 1913 and thereafter was reported to be absent from the islands by the 1940s (BirdLife South Africa 2018b).
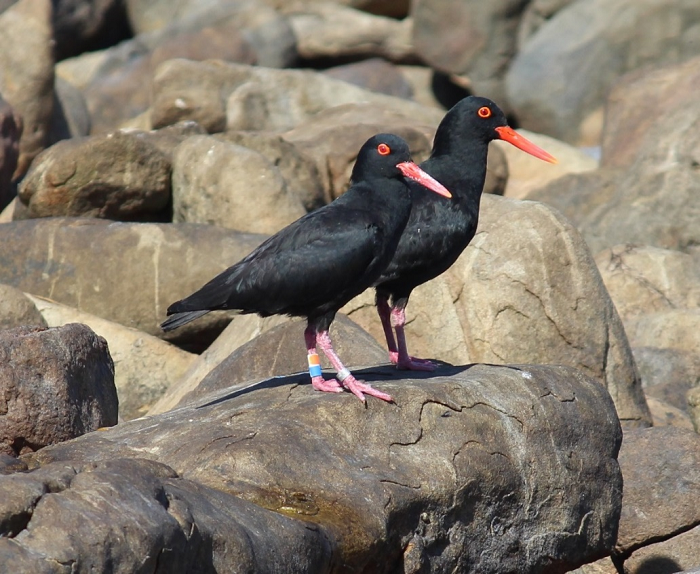
The African black oystercatcher Haemetopus moquini (Figure 1) is not considered a Red-listed species globally or regionally but this endemic and iconic bird was expected to decline due to a variety of anthropogenic and natural influences. It used to be considered ‘Near-threatened’ regionally. However, due to conservation efforts and the spread of the alien Mediterranean Mussel Mytilus galloprovincialis, the regional population increased (Taylor et al. 2015). These changes in distribution are evident in this paper and explained in more detail below.

The assessment of changes in abundance for this species from SABAP1 (Figure 2) to SABAP2 (Figure 3) is somewhat complicated by intra-African migratory habits as well as more localised dispersion of juvenile birds (Hockey et al. 2003).


African black oystercatcher Haematopus moquini
A true coastal bird, Summers and Cooper (1977) showed that this species inhabits mostly coastal islands and to a lesser degree sandy shores and wetlands. The African black oystercatcher has received much attention from the scientific community before and after the start of the 21st century on all aspects of its ecology, and SABAP data paint a picture similar to what was found to be a western and eastern population of migratory and dispersing juvenile birds, respectively.
These ‘western birds’ were calculated to make up 36-46% of all juveniles born in South Africa. The western population’s migratory individuals travel to nurseries in Namibia and Angola whereas the eastern population ‘diffusion dispersers’ travel within the South African breeding range (Hockey et al. 2003). Recent and obvious range expansion into KwaZulu-Natal Province, has been well documented by Brown and Hockey (2007) and can now be backed by the range-change map displayed here calculated from more than 100 citizen scientist contributions (Figure 4).

Whereas the western range-changes show as a mix of decreases and increases in distribution, the eastern range of this species shows mostly clear and large to very large increases starting from approximately 32° South latitude and 29° East longitude (Figure 4 and Table 1). Apart from the ‘recent’ increases in distribution northward along the eastern South African coastline, Figure 3 also shows a contiguous distribution of small SABAP2 reporting rates from this juncture northwards. This area of the coastline with smaller reporting rates contrasts with the generally larger reporting rates along the remainder of the South African coastline.
Table 1. Range-change summary for the African black oystercatcher between SABAP1 and SABAP2. Numbers (and percentages) in each colour category of Figure 4, for which there are at least four checklists per quarter degree grid cell in both SABAP1 and SABAP2. Also shown are the same summaries when the analysis is restricted to grid cells with at least 30 checklists for both SABAP1 and SABAP2.
| 4+ checklists | 30+ checklists | |||
|---|---|---|---|---|
| Status | Count | % | Count | % |
| Red (very large decrease) | 20 | 14 | 10 | 10 |
| Orange (large decrease) | 19 | 14 | 18 | 18 |
| Yellow (small decrease) | 17 | 12 | 16 | 16 |
| Light green (small increase) | 17 | 12 | 15 | 15 |
| Dark green (large increase) | 25 | 18 | 18 | 18 |
| Blue (very large increase) | 41 | 29 | 25 | 25 |
| Total | 139 | 100 | 102 | 100 |
Possible reasons for this relatively recent and northern presence could be due to southern populations experiencing food shortages during the breeding season that result in seasonal dispersion (Kohler et al. 2011). Another possibility for the dispersion could be that carrying capacity on the mainland has been reached (Du Toit et al. 2003) inside the breeding areas where largest reporting rates are evident (Figure 3). Also inside the oystercatcher’s breeding range, the alien Mediterranean mussel (Branch and Steffani 2004, Taylor et al. 2015, Zardi et al. 2018) serves as an additional, abundant and prolific food source (Hockey and Schurink 1992). This probably explains the largest reporting rates along the South to South-western region of the coastline that coincide with the mussel’s distribution range (Zardi et al. 2018).
Acknowledgements
This paper is part of a series, which celebrates the contributions of thousands of citizen scientists to the databases of the first and second bird atlas projects in Southern Africa (SABAP1 and SABAP2). From 2007 to March 2017, SABAP2 (Underhill 2016) was a partnership project of SANBI (South African National Biodiversity Institute), BirdLife South Africa and the Animal Demography Unit in the Department of Biological Science at the University of Cape Town.
References
BirdLife International 2018a. Species factsheet: Haematopus chathamensis. Downloaded from http://www.birdlife.org on 21/05/2018.
BirdLife International 2018b. Species factsheet: Haematopus meadewaldoi. Downloaded from http://www.birdlife.org on 21/05/2018.
Branch GM, Steffani CN 2004. Can we predict the effects of alien species? A case-history of the invasion of South Africa by Mytilus galloprovincialis (Lamarck). Journal of Experimental Marine Biology and Ecology 300.1-2: 189-215.
Brown M, Hockey PA 2007. The status and distribution of African black oystercatchers Haematopus moquini in Kwazulu-Natal, South Africa. Ostrich 78.1: 93-96.
Du Toit M, Boere GC, Cooper J, De Villiers MS, Kemper J, Lenten B, Petersen SL, Simmons RE, Underhill LG, Whittington PA, Byers OP 2003. Conservation assessment and management plan for southern African coastal seabirds. Avian Demography Unit & Conservation Breeding Specialist group. Cape Town, South Africa.
Hockey PAR, Leseberg A, Loewenthal D 2003. Dispersal and migration of juvenile African Black Oystercatchers Haematopus moquini. Ibis 145.3.
Hockey PAR, van Erkom Schurink C 1992. The invasive biology of the mussel Mytilus galloprovincialis on the southern African coast. Transactions of the Royal Society of South Africa 48.1: 123-139.
Kohler SA, Connan M, Hill JM, Mablouké C, Bonnevie B, Ludynia K, Kemper J, Huisamen J, Underhill LG, Cherel Y, McQuaid CD 2011. Geographic variation in the trophic ecology of an avian rocky shore predator, the African black oystercatcher, along the southern African coastline. Marine Ecology Progress Series 435: 235-249.
Summers RW, Cooper J 1977. The population, ecology and conservation of the Black Oystercatcher Haematopus moquini. Ostrich 48.1-2: 28-40.
Taylor MR, Peacock F, Wanless RW (eds) 2015. The Eskom Red Data Book of Birds of South Africa, Lesotho and Swaziland. BirdLife South Africa. Johannesburg, South Africa.
Underhill LG 2016. The fundamentals of the SABAP2 protocol. Biodiversity Observations 7.42: 1-12. Available online at http://bo.adu.org.za/content.php?id=235.
Underhill LG, Brooks M 2016a. Pentad-scale distribution maps for bird atlas data. Biodiversity Observations 7.52: 1-8. Available online at http://bo.adu.org.za/content.php?id=245.
Underhill LG, Brooks M 2016b. Displaying changes in bird distributions between SABAP1 and SABAP2. Biodiversity Observations 7.62: 1-13. Available online at http://bo.adu.org.za/content.php?id=255.
Zardi GI, McQuaid CD, Jacinto R, Lourenço CR, Serrão EA, Nicastro KR 2018. Re-assessing the origins of the invasive mussel Mytilus galloprovincialis in southern Africa. Marine and Freshwater Research 69.4: 607-613.


