


Paardeberg Inselberg is surrounded by vineyards and farms, but patches of fynbos, trees, farm dams, homestead gardens provide varied habitat and good diversity of birds. Ringing has been conducted at Bowwood farm and Fynbos Estate.
On 27 April 2019 Loutjie Steenberg, Taylyn Risi and I ringed on Sonop farm and caught 43 birds of 13 species. Three birds were recaptures from a previous ringing visit by Loutjie on 29 July 2018 – a Karoo Prinia, a Cape Weaver and a Southern Masked Weaver.
The Southern Masked Weaver shown was a recapture – it was moulting its head feathers into breeding plumage (the growing feathers with sheaths were black or yellow), rather early for a weaver in a rural area.
The species of the day was Neddicky, being the first time this species has been ringed anywhere on the Paardeberg.

This ringing session brings a total of 777 birds of 39 species ringed on the Paardeberg over 2018-19.
| Species | n |
| Cape Turtle Dove | 1 |
| Cape Bulbul | 2 |
| Cape Robin | 6 |
| Neddicky | 2 |
| Fiscal Flycatcher | 2 |
| Fiscal Shrike | 1 |
| Cape Weaver | 8 |
| Southern Masked Weaver | 7 |
| Yellow Bishop | 4 |
| Cape Canary | 1 |
| Bully Canary | 1 |
| Cape White-eye | 5 |
| Karoo Prinia | 3 |
| Total | 43 |
Awoyemi AG and Bown D. 2019. Bird conservation in Africa – the contributions of the Ibadan Bird Club. Biodiversity Observations 10.9:1-12


Biodiversity Observations is an open access electronic journal published by the Animal Demography Unit at the University of Cape Town. This HTML version of this manuscript is hosted by the Biodiversity and Development Institute. Further details for this manuscript can be found at the journal page, and the manuscript page, along with the original PDF.
The Ibadan Bird Club has met 19 times at monthly intervals between February 2016 and August 2017, and 264 people (155 male and 109 female) have registered as members. During this period, the club has successfully built local capacity in bird conservation, and 111 bird species, distributed in 39 families, have been documented in an urban Important Bird Area, southwestern Nigeria. The findings of this citizen science initiative are essential for conservation purposes.
Conservation efforts produce remarkable results when stakeholders (landowners, indigenes, visitors, organizations and authorities) are involved in activities (Awoyemi et al. 2018). The stakeholders can contribute through citizen science, which is the collection of ecological data by members of the general public and non-specialists as part of scientific projects (Dickinson et al. 2012). This has been successful worldwide, especially in Australia (Tulloch et al. 2013), Europe (Silvertown, 2009) and North America (Dickinson et al. 2012), where enthusiasts, volunteers and nature lovers contribute data via bird and nature clubs. In some parts of Africa, citizen scientists now contribute data to bird atlas projects, which aim to map the distribution of birds in the continent (Hulbert, 2016; Ivande et al. 2017). The African Bird Club has taken this initiative by funding the establishment of bird clubs in Africa, notably the Ibadan Bird Club (IBC) (Demey, 2015).
The IBC was started on 5 March 2014 by the Nigerian Conservation Foundation in partnership with the Department of Wildlife and Ecotourism Management, University of Ibadan, and the Forest Project at the International Institute of Tropical Agriculture (IITA), Ibadan, Nigeria (Demey, 2015). The aim was to build local capacity and enhance the conservation of birds in the Ibadan area. On 13 February 2016, the club was re-launched, so that it could be coordinated by the IITA Forest Unit as an activity of the A. G. Leventis-funded Ornithological Monitoring Project 2015-2017 (Figs. 1-3). The contributions of the club to bird conservation from then until August 2017 are presented here.


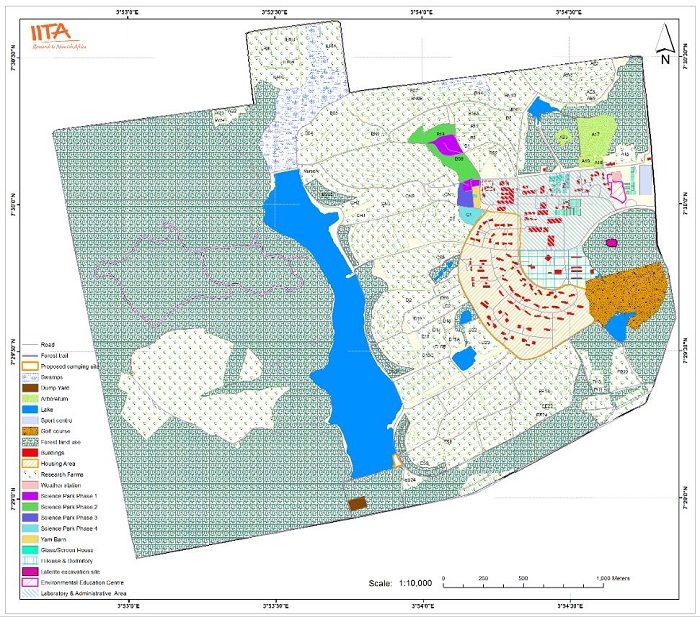
The activities of the IBC since its re-launch have been carried out within the IITA campus, Ibadan (7° 29’ N, 3° 54’ E; Fig. 4). The approx. 1000 ha campus is located in the transition zone between savannah and rainforest, and experiences two distinct seasons: wet (April-September) and dry (October-March) (Neuenschwander et al. 2015). The campus has different kinds of habitats (forests, wetlands, farmlands and gardens) and supports over 270 species of birds, which are either Afro-tropical residents or migratory (Ezealor, 2001; Adeyanju et al. 2014). The approx. 360 ha forest reserve within the campus is dominated by native trees such as , , and (Manu et al. 2005). It also holds 67 bird species that are restricted to the Guinea-Congo Forest Biome, qualifying it as an Important Bird Area (IBA) (Ezealor, 2001). It is our understanding that this is the only IBA in Nigeria located in a major conurbation, justifying the need for capacity building at the local level. The campus also contains a large reservoir, several lakes and a number of fishponds which constitute important habitats for waterbirds while crops such as banana, cassava, cowpea, maize, plantain, rice and yam are cultivated in the research farm.
The IBC has no badging but there is a unique structure that produces results. Typically an invitation, which contains a striking photo taken by a member, is sent at least 3 days before the new meeting date, which is fixed on the last Saturday of every month at 16h00 – 18h00. All levels of age, interest and experience are encouraged, and membership is free. Member attendance is noted and feedback is given in the form of short reports sent after each meeting while the members interact online via the club’s Facebook Group Page. Since the main focus of the club is capacity building, the coordinators (authors) normally stop at regular intervals to explain some aspects of avian ecology and the relevance of environmental education and citizen science to biodiversity conservation. The junior members of the club (IBC Juniors) are given high priority, and engaged in activities such as quizzes, debates, drawing contests, mist-netting and presentations in scientific workshops, in addition to birdwatching. In order to consolidate the knowledge gained during the meetings, club members are invited to workshops organised by the IITA Forest Unit Ornithological Monitoring Project on topics such as IBAs, Spring Alive and the World Migratory Bird Day.
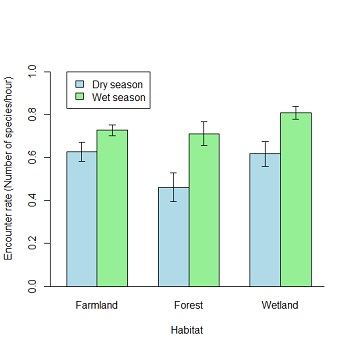
Data were collected from February 2016 to August 2017 during meetings of the IBC. During this time, 19 meetings were held but data from 18 meetings (equally distributed between dry and wet seasons) were used in analysing our biological data as rain did not allow for a complete survey in June 2017 and the record was excluded. Therefore a total of 36 hours was spent during the meetings (survey). On arrival at the meeting venue, new members were normally introduced to the basics of birdwatching and use of equipment. Visits were then made to the three main habitats in the study area (farmland, forest and wetland), with each habitat receiving an equal number of visits (N=6). Line transects, measuring approx. 1.5 km were used to record all birds seen or heard during each walk (Bibby et al. 2000), though no fixed radius was set. There was no obvious change in vegetation during the data collection, therefore we did not measure vegetation variables but described the visited habitats as above. Consequently, we predicted that changes in bird encounter rate would be influenced mainly by habitat and season.
We calculated encounter rate as the number of species recorded per 2-hour survey (Guilherme, 2014), which was our response variable. We then graphically explored our dataset, and tested its normality using Shapiro-Wilk normality test: W = 0.654, p < 0.001. As this was not normally distributed even after transformation, we used Poisson Logistic Regression to test the difference in encounter rate between habitats and seasons in R statistical Software (R Development Core Team, 2013).
Furthermore, the species’ local abundance was estimated using this formula: (Ti/Tn) x 100; where Ti = number of transects along which a species was recorded, and Tn = the total number of transects surveyed (Asefu, 2015). We then classified species as common (observed on >75% of transects), frequent (observed on 50-74% of transects), uncommon (observed on 25-49% of transects) or rare (observed on <25% of transects) following Asefu (2015). We also assigned species to one of 3 major habitats (Redman et al. 2009; Borrow & Demey 2010): (1) aquatic species (wetlands, lakes and marshes); (2) forest species (closed forest); and (3) open habitat species (farmlands with scattered trees and grassland).
Our sociological data reveal that 264 people have registered as members of the IBC since its re-launch. Among these were 155 male (59%), 109 female (41%) and 27 juniors under the age of 12 years (10%). The club has been consistent in its activities, and an average of 31 members attends the monthly meetings.
Biologically, 111 bird species belonging to 39 families were recorded during the survey; their relative frequency, status, biomes and habitat requirements are listed in Appendix 1. Among these were 21 species restricted to the Guinea-Congo Forests Biome, 1 species restricted to the Sudan-Guinea Savannah Biome, 7 Palaearctic migrants and 16 Intra-African migrants, while the rest were resident (Appendix 1). This diversity of birds may be attributed to the different kinds of habitats found within the study area, which allows birds to exploit them differently. For instance, all the 21 species restricted to the Guinea-Congo Forests Biome were recorded within the forest reserve, the yellow-billed shrike (restricted to the Sudan-Guinea Savannah Biome) was recorded only in farmlands, while the palaearctic and Intra-African migrants mainly utilized farmlands and wetlands. Poisson Logistic Regression shows that bird encounter rate significantly differs between habitats and seasons (Table 1; Fig. 5).
| Parameters | Estimate | Error | z | p |
|---|---|---|---|---|
| Intercept | 0.52325 | 0.09622 | 5.438 | <0.001 |
| Habitat (forest) | -0.07696 | 0.13472 | -0.571 | 0.568 |
| Habitat (wetland) | 0.46761 | 0.12348 | 3.787 | <0.001 |
| Season (wet) | 0.45689 | 0.11568 | 3.949 | <0.001 |
| forest x wet | -0.60378 | 0.19041 | -3.171 | <0.001 |
| wetland x wet | -0.51344 | 0.15644 | -3.282 | <0.001 |
Effective conservation of biodiversity largely depends on the involvement of stakeholders. Our findings have revealed that their involvement increases the appreciation of the natural world. If well-engaged, they can also contribute data which are essential for formulating conservation strategies as presented here. The IBC has successfully raised awareness about bird conservation and engaged citizen scientists. The club has attracted the attention of indigenes, visitors/tourists, enthusiasts, professionals, researchers and students, who in turn disseminate the knowledge gained from the club to a wider audience such as colleagues, families and friends. In addition, the influence generated online via the Facebook Group Page is producing positive cascading effects. Worthy of note is the performance of the IBC Juniors whose age averages 9 years. Children learn quickly at tender ages, and we have maximized this opportunity to inculcate environmental and conservation values in them. It is anticipated that both the values and practical skills will provide a worthwhile basis for their contributions to society as citizens of the future.
Given the focus of this study, which is citizen science, our biological data undoubtedly under-estimate bird diversity in the study area (see Adeyanju et al. 2014). It is also important to note that we were more interested in the number of species encountered per habitat but the fact that more birds were encountered in a certain habitat does not imply it is richer. In addition, the survey was carried out towards late afternoon, implying that we have missed out on some birds at dawn. Nevertheless, the study has added to the goal of constant monitoring of birds and habitats, and local capacity has been built. In addition, our study has affirmed the ornithological significance of the study area by recording 21 out of the 67 bird species that qualify the IITA Forest Reserve as an IBA (Ezealor, 2001). The yellow-billed shrike , a species restricted to the Sudan-Guinea Savannah Biome was recorded during our expeditions. Although this is hardly surprising due to the location of the study area in the transition zone between the forest and savannah (Neuenschwander et al. 2015), this might also provide a clearer indication of savannah encroachment into the forest zone. By occurring in nearly all the habitat types, three species were the most commonly recorded throughout the survey: red-eyed dove (18/18), African pied hornbill (17/18) and pied crow (16/18).
Interestingly, more birds were encountered in the wet than dry season in all three habitats (Table 1; Fig. 5). On the one hand, this may be due to the influx of migratory birds at the end of the wet season in August and September as the study area serves as an important wintering ground for Palaearctic migrants. On the other hand, it may be due to the recruitment of new individuals as most Afro-tropical resident birds are known to breed during the wet season when food is plentiful (Elgood et al. 1994). As IITA is an agricultural research institute, mechanized farming is carried out within the campus. During two of our bird walks during the wet season, over 50 birds at a time were noted intensively foraging behind tractors as they ploughed in the research fields. This might account for the higher number of birds recorded in this habitat during the wet season. In addition, we also noted that heavy downpours caused some lakes to overflow their banks. While this may appear hazardous, receding water increases the concentration of prey available to birds foraging along water bodies (Cumming et al. 2012).
In conclusion, we have provided evidence that environmental education via bird clubs is vital for bird conservation. Our findings from the citizen science data presented here may be the first in Africa and, given the rate at which habitats are lost due to anthropogenic activities, environmental education and citizen science are particularly important now. Although the activities of the IBC were restricted to the IITA campus during this reporting period, plans are underway to replicate activities in other areas around Ibadan. We will also endeavour to get more birdwatching equipment and materials (binoculars, telescopes, cameras, bird song recorders and guidebooks) to better serve the average number of members we expect at monthly meetings.
Authors are grateful to the following people and organizations: all IBC members who supported the activities of the club; Chima Nwaogu and Sam Ivande advised on statistical analyses; Shiiwua Manu and Phil Hall commented on an earlier draft; the AG. Leventis Foundation funded the IBC as part of the Ornithological Monitoring Project, and IITA-Ibadan hosted the activities of the club. This is publication number 146 from the A. P. Leventis Ornithological Research Institute (APLORI), Jos, Nigeria.
Adeyanju TA, Ottosson U, Adeyanju T, Omotoriogun T, Hall P, Manu S, Alabi T, Lameed G, and Bown D. 2014. Birds of the International Institute of Tropical Agriculture campus, a stronghold of avian diversity in the changing Ibadan area (Nigeria) over the last 50 years. Malimbus 36:76-105.
Asefu A. 2015. Bird observations in Muktar Mountain Forest, eastern Ethiopia: a previously unidentified Important Bird Area. Bulletin of the African Bird Club 22(1):36-42.
Awoyemi AG, Bown D, Manu S, Ajayi A, Olasupo O, and Olubodun O. 2018. First breeding record of Ahanta Francolin Pternistis ahantensis for Nigeria. Bulletin of the African Bird Club 25(1):70-71.
Bibby CJ, Burgess ND, and Hill DA. 2000. Bird census techniques. London: Academic Press.
Borrow N, and Demey, R. 2010. Birds of Western Africa. Christopher Helm, London.
Cumming GC, Paxton M, King J, and Beuster H. 2012. Foraging guild membership explains variation in waterbird responses to the hydrological regime of an arid-region flood-pulse river in Namibia. Freshwater Biology 57:1202-1213. https://doi.org/10.1111/j.1365-2427.2012.02789.x
Demey R. 2015. Volunteers for bird conservation. Bulletin of the African Bird Club 22(1):11.
Dickinson JL, Shirk J, Bonter D, Bonney R, Crain RL, Martin J, Philips T, and Purcell K. 2012. The current state of citizen science as a tool for ecological research and public engagement. Frontiers in Ecology and the Environment 10(6):291-297. https://doi.org/10.1890/110236
Elgood JH, Heigham JB, Moore AM, Nason AM, Sharland RE, and Skinner NJ. 1994. The birds of Nigeria: an annotated check-list (2nd edition). The Natural History Museum, Tring, Herts HP23 6AP, UK.: British Ornithologists’ Union.
Ezealor EA. 2001. Nigeria. In Fishpool LDC, and Evans MI (eds.). Important Bird Areas in Africa and Associated Islands: Priority Sites for Conservation. Newbury: Pisces Publications and Cambridge, UK: BirdLife International.
Guilherme JL. 2014. Birds of the Boe region, south-east Guinea-Bissau, including the first country records of Chestnut-backed Sparrow Lark Eremopterix leucotis, Lesser Striped Swallow Cecropis abyssinica and Heuglin’s Wheatear Oenanthe heuglini. Bulletin of the African Bird Club 21(2):155-168.
Hulbert J. 2016. Citizen science tools available for ecological research in South Africa. South African Journal of Science 112(5/6):1-2.
Ivande ST, Talatu T, and Ottosson U. 2016. Nigeria Bird Atlas Project: how far so far? progress report august 2016. Biodiversity Observations 7(50):1-3.
Manu S, Peach W, Bowden C, and Cresswell W. 2005. The effects of forest fragmentation on the population density and distribution of the globally Endangered Ibadan Malimbe Malimbus ibadanensis and other malimbe species. Bird Conservation International 15:275-285. https://doi.org/10.1017/S0959270905000444
Neuenschwander P, Bown D, Hèdégbètan GC, and Adomou A. 2015. Long-term conservation and rehabilitation of threatened rain forest patches under different human population pressures in West Africa. Nature Conservation 13:21-46. https://doi.org/10.3897/natureconservation.13.6539
R Development Core Team. 2013. R: A language and environment for statistical computing. R Foundation for Statistical Computing, Vienna, Austria. ISBN 3-900051-07-0, URL http://www.R-project.org/.
Redman N, Stevenson T, and Fanshawe J. 2009. Birds of the Horn of Africa. London, UK: Christopher Helm.
Silvertown J. 2009. A new dawn for citizen science. Trends in Ecology and Evolution 24(9):467-471.
Tulloch AIT, Possingham HP, Joseph LN, Szabo J, and Martin TG. 2013. Realising the full potential of citizen science monitoring programs. Biological Conservation 165:128-138. https://doi.org/10.1016/j.biocon.2013.05.025
| Family | English name | Scientific name | Relative frequency | Status | Biome | Habitiat |
|---|---|---|---|---|---|---|
| Phalacrocoracidae | ||||||
| long-tailed cormorant | Phalacrocorax africanus | R | R | AQ | ||
| Ardeidae | ||||||
| purple heron | Ardea purpurea | U | P | AQ | ||
| squacco heron | Ardeola ralloides | U | P | AQ | ||
| intermediate egret | Egretta intermedia | U | R | AQ | ||
| little bittern | Ixobrychus minutus | R | P | AQ | ||
| black-headed heron | Ardea melanocephala | U | R | OH | ||
| grey heron | Ardea cinerea | R | P | AQ | ||
| cattle egret | Bubulcus ibis | U | M | OH | ||
| green-backed heron | Butorides striata | R | R | AQ | ||
| great egret | Egretta alba | R | M | AQ | ||
| little egret | Egretta garzetta | R | M | AQ | ||
| Threskiornithidae | ||||||
| hadeda ibis | Bostrychia hagedash | R | R | AQ | ||
| Anatidae | ||||||
| white-faced whistling duck | Dendrocygna viduata | F | R | AQ | ||
| Accipitridae | ||||||
| African harrier hawk | Polyboroides typus | R | R | FR | ||
| African cuckoo hawk | Aviceda cuculoides | R | R | OH | ||
| palm-nut vulture | Gypohierax angolensis | R | R | FR | ||
| African goshawk | Accipiter tachiro | R | R | OH | ||
| yellow-billed kite | Milvus aegyptius | F | M | OH | ||
| Falconidae | ||||||
| lanner falcon | Falco biarmicus | R | R | OH | ||
| grey kestrel | Falco ardosiaceus | R | R | OH | ||
| common kestrel | Falco tinnunculus | U | R | OH | ||
| Numididae | ||||||
| helmeted guineafowl | Numida meleagris | R | R | OH | ||
| Phasianidae | ||||||
| double-spurred francolin | Francolinus bicalcaratus | U | R | OH | ||
| Rallidae | ||||||
| African crake | Crex egregia | R | M | AQ | ||
| Allen’s gallinule | Porphyrio alleni | R | M | AQ | ||
| black crake | Amaurornis flavirostra | R | R | AQ | ||
| common moorhen | Gallinula chloropus | R | R | AQ | ||
| Jacanidae | ||||||
| African jacana | Actophilornis africana | F | R | AQ | ||
| Burhinidae | ||||||
| Senegal thicknee | Burhinus senegalensis | R | R | AQ | ||
| Charadriidae | ||||||
| white-headed lapwing | Vanellus albiceps | F | R | AQ | ||
| Forbes’s plover | Charadrius forbesi | R | R | AQ | ||
| spur-winged lapwing | Vanellus spinosus | F | R | AQ | ||
| Scolopacidae | ||||||
| wood sandpiper | Tringa glareola | R | P | AQ | ||
| common sandpiper | Actitis hypoleucos | R | P | AQ | ||
| Columbidae | ||||||
| red-eyed dove | Streptopelia semitorquata | C | R | OH | ||
| speckled pigeon | Columba guinea | U | R | OH | ||
| blue-spotted wood dove | Turtur afer | U | R | FR | ||
| African green pigeon | Treron calvus | R | R | FR | ||
| Musophagidae | ||||||
| western grey plantain-eater | Crinifer piscator | R | R | OH | ||
| green turaco | Tauraco persa | R | R | GCF | FR | |
| Cuculidae | ||||||
| black cuckoo | Cuculus clamosus | R | M | OH | ||
| black-throated coucal | Centropus leucogaster | R | R | GCF | FR | |
| blue-headed coucal | Centropus monachus | R | R | AQ | ||
| Diederik cuckoo | Chrysococcyx caprius | R | M | OH | ||
| Klaas’s cuckoo | Chrysococcyx klaas | R | M | OH | ||
| Senegal coucal | Centropus senegalensis | F | R | OH | ||
| yellowbill | Ceuthmochares aereus | R | R | FR | ||
| Apodidae | ||||||
| African palm swift | Cypsiurus parvus | R | R | OH | ||
| little swift | Apus affinis | R | R | OH | ||
| mottled spinetail | Telacanthura ussheri | R | R | OH | ||
| Alcedinidae | ||||||
| woodland kingfisher | Halcyon senegalensis | F | M | OH | ||
| malachite kingfisher | Alcedo cristata | R | R | AQ | ||
| blue-breasted kingfisher | Halcyon malimbica | R | R | FR | ||
| Meropidae | ||||||
| white-throated bee-eater | Merops albicollis | R | M | OH | ||
| Coraciidae | ||||||
| broad-billed roller | Eurystomus glaucurus | R | M | OH | ||
| Bucerotidae | ||||||
| African pied hornbill | Tockus fasciatus | C | R | FR | ||
| African grey hornbill | Tockus nasutus | U | M | OH | ||
| Capitonidae | ||||||
| red-rumped tinkerbird | Pogoniulus atroflavus | R | R | GCF | FR | |
| Hirundinidae | ||||||
| lesser striped swallow | Hirundo abyssinica | R | M | OH | ||
| red-rumped swallow | Hirundo daurica | R | M | OH | ||
| Ethiopian swallow | Hirundo aethiopica | R | R | OH | ||
| Motacillidae | ||||||
| plain-backed pipit | Anthus leucophrys | R | R | OH | ||
| African pied wagtail | Motacilla aguimp | R | R | OH | ||
| yellow-throated longclaw | Macronyx croceus | U | R | OH | ||
| Pycnonotidae | ||||||
| common bulbul | Pycnonotus barbatus | F | R | OH | ||
| swamp palm bulbul | Thescelocichla leucopleura | R | R | GCF | FR | |
| simple leaflove | Chlorocichla simplex | R | R | GCF | FR | |
| little greenbul | Andropadus virens | R | R | FR | ||
| grey-headed bristlebill | Bleda canicapillus | R | R | GCF | FR | |
| yellow-whiskered greenbul | Andropadus latirostris | R | R | FR | ||
| western nicator | Nicator chloris | R | R | GCF | FR | |
| Turdidae | ||||||
| African thrush | Turdus pelios | F | R | OH | ||
| whinchat | Saxicola rubetra | R | P | OH | ||
| snowy-crowned robin chat | Cossypha niveicapilla | R | R | OH | ||
| Sylviidae | ||||||
| green crombec | Sylvietta virens | R | R | GCF | FR | |
| red-faced cisticola | Cisticola erythrops | U | R | OH | ||
| short-winged cisticola | Cisticola brachypterus | R | R | OH | ||
| tawny-flanked prinia | Prinia subflava | R | R | OH | ||
| African moustached warbler | Melocichla mentalis | R | R | OH | ||
| grey-backed camaroptera | Camaroptera brachyura | R | R | OH | ||
| olive green camaroptera | Camaroptera chloronota | R | R | GCF | FR | |
| green hylia | Hylia prasina | R | R | GCF | FR | |
| croaking cisticola | Cisticola natalensis | R | R | OH | ||
| yellow-browed camaroptera | Camaroptera superciliaris | R | R | GCF | FR | |
| Monarchidae | ||||||
| red-bellied paradise flycatcher | Terpsiphone rufiventer | R | R | GCF | FR | |
| blue-headed crested flycatcher | Trochocercus nitens | R | R | GCF | FR | |
| Nectarinidae | ||||||
| splendid sunbird | Cinnyris coccinigastrus | U | R | FR | ||
| collared sunbird | Hedydipna colaris | R | R | FR | ||
| green-headed sunbird | Cyanomitra verticalis | R | R | OH | ||
| blue-throated brown sunbird | Cyanomitra cyanolaema | R | R | GCF | FR | |
| olive sunbird | Cyanomitra olivacea | R | R | FR | ||
| olive-bellied sunbird | Cinnyris chloropygius | R | R | FR | ||
| Laniidae | ||||||
| yellow-billed shrike | Corvinella corvina | R | R | SGS | OH | |
| Malaconotidae | ||||||
| tropical boubou | Laniarius aethiopicus | R | R | FR | ||
| Oriolidae | ||||||
| black-winged oriole | Oriolus nigripennis | R | R | GCF | FR | |
| Dicuridae | ||||||
| fork-tailed drongo | Dicrurus adsimilis | U | R | OH | ||
| square-tailed drongo | Dicrurus ludwigii | R | R | OH | ||
| Corvidae | ||||||
| pied crow | Corvus albus | C | R | OH | ||
| Sturnidae | ||||||
| forest chestnut-winged starling | Onychognathus fulgidus | R | R | GCF | FR | |
| Passeridae | ||||||
| northern grey-headed sparrow | Passer griseus | R | R | OH | ||
| Ploceidae | ||||||
| red-headed quelea | Quelea erythrops | R | M | OH | ||
| Vieillot’s black weaver | Ploceus nigerrimus | R | R | GCF | FR | |
| village weaver | Ploceus cucullatus | R | R | OH | ||
| red-headed malimbe | Malimbus rubricollis | U | R | GCF | FR | |
| red-vented malimbe | Malimbus scutatus | R | R | GCF | FR | |
| yellow-mantled weaver | Ploceus tricolor | R | R | GCF | FR | |
| northern red bishop | Euplectes franciscanus | R | R | OH | ||
| Estrididae | ||||||
| bronze mannikin | Spermestes cucullatus | F | R | OH | ||
| grey-headed negrofinch | Nigrita canicapillus | R | R | GCF | FR | |
| orange-cheeked waxbill | Estrilda melpoda | R | R | OH | ||
| Viduidae | ||||||
| pin-tailed whydah | Vidua macroura | U | R | OH |

Franke-Bryson U. 2019. Greedy southern pale chanting goshawk Melierax canorus. Biodiversity Observations 10.8:1-7
Biodiversity Observations is an open access electronic journal published by the Animal Demography Unit at the University of Cape Town. This HTML version of this manuscript is hosted by the Biodiversity and Development Institute. Further details for this manuscript can be found at the journal page, and the manuscript page, along with the original PDF.
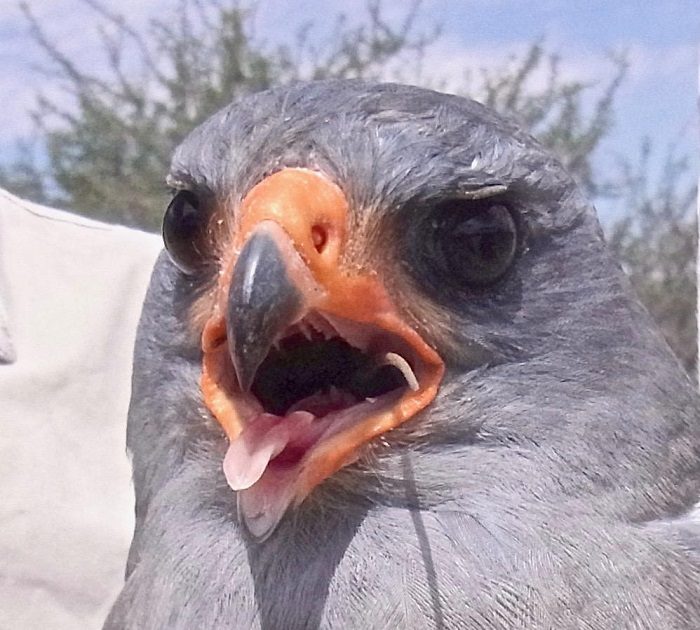
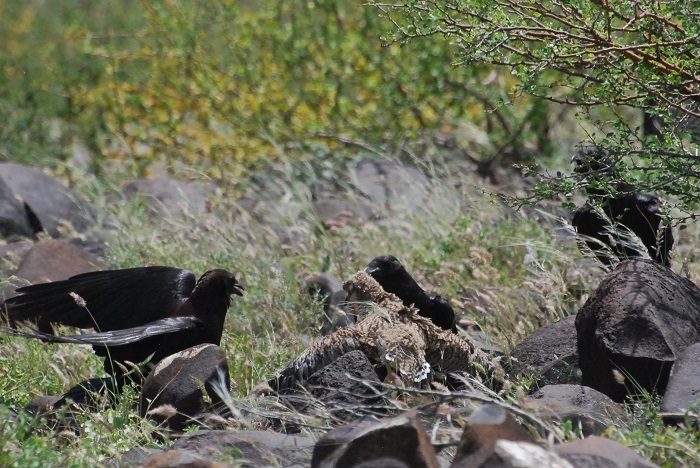
Southern pale chanting goshawks (Melierax canorus) never miss an opportunity for feeding on any creature living or dead. Here three birds are recorded with the beak or crop still full, and hunting techniques and diet are described.
Southern pale chanting goshawk hunting skills encompass a great variety of techniques. They hunt alone or in groups. They mainly hunt smaller prey, but are capable of killing animals heavier than themselves. The local available biodiversity determines the composition of the diet, which is generally highly diverse. Among recorded prey items are mammals (mainly rodents), birds (a variety of species ranging from larks, swallows, weavers to the size of francolin, korhaan, sandgrouse, owls and guineafowl) (Malan and Crowe 1996). Predation records have included a stunned rock kestrel or sometimes chickens (Steyn 1982). Southern pale chanting goshawks have also been recorded predating reptiles, amphibians, and invertebrates (sunspiders, harvester termites, grasshoppers, beetles and other insects). Southern pale chanting goshawks also feed on carrion of any kind, from hares to owls (Stein 1982; Biggs et al. 1984; Malan and Crowe 1996; Allan 2005). In one incident they might have detected a carcass of an Egyptian goose (Alopochen aegyptiaca) by observing Cape crows (Corvus capensis) gathering nearby (Ryan et al. 2012).
Steyn (1982) reports lizards as the most common prey in Kenya, while a study in the Western Cape Province, South Africa, found that more than 90% of the diet consisted of three species of rodents: Karoo bush rat (Myotomys (Otomys) unisulcatus), Brants’ whistling rat (Parotomys brantsii) and four-striped grass mouse (Rhabdomys pumilio) (Malan and Crowe 1996). Malan (2017) found leopard tortoise (Stigmochelys pardalis) hatchlings being preyed upon, but only in their first two weeks while their carapaces, the outer shells, were still soft. In the arid savannah near Usakos, Namibia, (22° 24’S; 15° 25’E), I once saw two juvenile southern pale chanting goshawks, in the presence of one adult, dropping down clumsily on three young bat-eared foxes (Otocyon megalotis) who made it in time to their distant underground den, while the adult fox was defensively snapping into the air towards the attacking birds. It is unclear whether this behaviour was curiosity, hunting instinct, honing the hunting skills of the juveniles, or a serious attempt at predation in the harsh environment.
Southern pale chanting goshawks perch high up to swoop down on prey and may pursue their prey swiftly on foot, if needed. They run so “blisteringly fast with these long legs” that “they easily can catch a sunspider” (Malan 2017). In strong wind, hunting may be restricted to the ground (pers. obs.). Although most prey are caught on the ground, birds can also be predated in flight, as Steyn (1982) observed during predation on a crowned plover (Vanellus coronatus) and a harlequin quail (Coturnix delegorguei).
Southern pale chanting goshawks are also known to take advantage of the hunting skills of other animals, and follow mammals (mainly honey badger, Melivora capensis, and slender mongoose, Galerella sanguinea), other birds, and possibly rock monitors (Varanus albigularis), who all could flush prey by their presence, by digging and exploring holes. Pale chanting goshawks have been sighted hoping for secondary prey from a Cape cobra (Naja nivea) (Siebert and Siebert 2003; Vanderwalt 2016), and kleptoparasitising a booted eagle (Hieraaetus pennatus) (in Malan 1998, p. 199) and a pipit from a kestrel (Steyn 1982).
We have caught two different southern pale chanting goshawk individuals, which had swallowed lizards directly before our observations – the tail of a lizard was still sticking out of the throat when each came swooping down to its next prey in the form of a mouse in a trap (Figures 1 and 2). Bird ringers might have experienced that a southern pale chanting goshawk will repeatedly try to take the bait whenever an attempt (or more) of catching the bird with a bal-chatri trap has failed. A bal-chatri is a cage containing a live rodent used to attract the attention of the raptor, and with nooses or fishline on top of the cage to entangle the raptor’s feet when landing and trying to catch the bait (de Beer 2001).
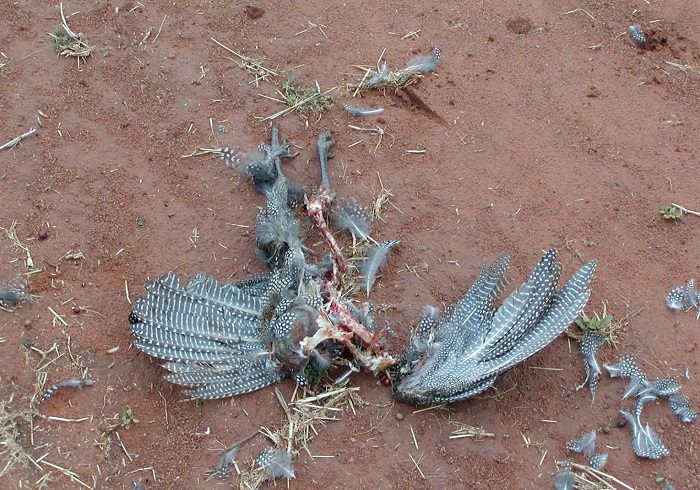
A further adult female was trapped and ringed coming straight from a fresh helmeted guineafowl (Numida meleagris) kill. All flesh had been consumed. The southern pale chanting goshawk came to the bal-chatri already with a huge crop (Figures 3 and 4). As the site was near a gravel road, it remains unclear whether the southern pale chanting goshawk had killed the guineafowl or whether it had been hit by a car.

I am grateful to Susan Mvungi from the Niven Library, Percy FitzPatrick Institute of African Ornithology, University of Cape Town, for supporting me with access to literature, and to Dane Paijmans for revising the text.
Allan DG 2005. Southern Pale Chanting Goshawk. In: Hockey PAR, Dean WRJ, Ryan PG (eds). Roberts Birds of Southern Africa. 7th Ed. The Trustees of the John Voelcker Bird Book Fund, Cape Town. pp 509-511.
de Beer SJ, Lockwood GM, Raijmakers JHFA, Raijmakers JMH, Scott WA, Oschadleus HD, Underhill LG 2001. SAFRING bird ringing manual. 2nd Ed. Animal Demography Unit, Cape Town.
Biggs HC, Biggs R, Freyer E 1984. Observations on the Chanting Goshawk Melierax canorus during a period of poor rainfall. Proceedings of the Second Symposium on African Predatory Birds 61-70. Natal Bird Club, Durban.
Ferguson-Lees J, Christie DA 2001. Raptors of the world. Christopher Helm, London. pp 512-513.
Kemp AC, Kirwan GM 2017. Pale Chanting Goshawk Melierax canorus. In: del Hoyo J, Elliott A, Sargatal J, Christie DA, de Juana E (eds). Handbook of the Birds of the World Alive. Lynx Edicions, Barcelona. Available from http://www.hbw.com/node/53039 (Accessed on on 29.10.2017).
Malan G 1998. Solitary and social hunting in Pale Chanting Goshawk Melierax canorus families: why use both strategies? Journal of Raptor Research 32:195-201.
Malan G 2017. The singing Goshawk. Available from http://www.wildcard.co.za/the-singing-goshawk/ (Accessed on on 20.7.2018).
Malan G, Crowe TM 1996. The diet and conservation of monogamous and polyandrous Pale Chanting Goshawks in the Little Karoo, South Africa. South African Journal of Wildlife Research 26:1-10.
Ryan PG, Shaw JM, van der Merwe R, van der Merwe E 2012. Carrion attraction: goshawks and other birds captured on camera traps. Ornithological Observations 3:102-106. Available from http://bo.adu.org.za/content.php?id=49 (Accessed on on 29.10.2017).
Siebert S, Siebert P 2003. Pale Chanting Goshawk following Cape Cobra. Promerops 254:19.
Steyn P 1982. Birds of prey of Southern Africa. Their identification and life histories. David Philip, Cape Town. pp 183-186.
Vanderwalt B 2016. Co-operative feeding. Biodiversity Observations 7.71:1. Available from http://bo.adu.org.za/content.php?id=264 (Accessed on 29.10.2017).
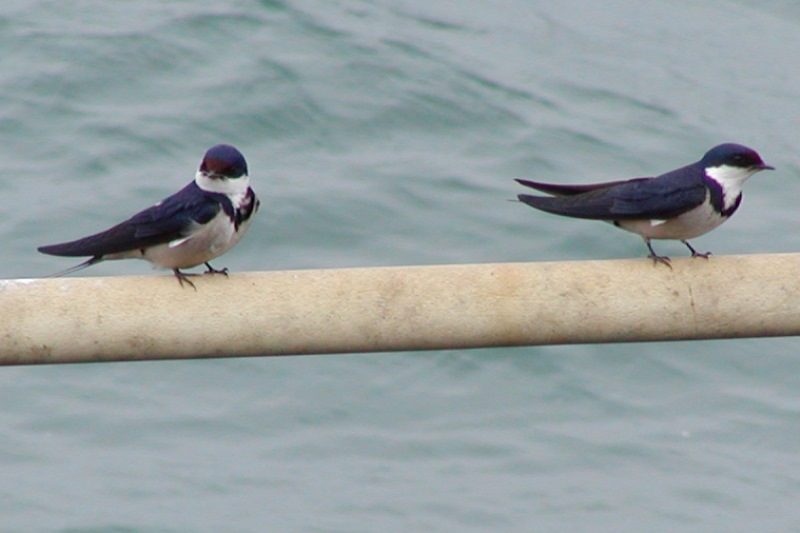
White-throated Swallows are common in Cape Town in the summer months, building their nests under the multiple bridges that cross canals and rivers. They migrate north in Africa to escape the wet Cape Town winter.
Ringing of these swallows (both adults and nestlings) has been opportunistic most of the time, while ringing weavers in wetlands around Cape Town. Nevertheless, some interesting data has been obtained. Most chicks were ringed in October and November, matching the peak of October to December. Brood size varied from 2 to 4 (average 2.8) – this compares with published clutch size of 2-5 (mean 3.2), suggesting a small mortality of eggs laid to chicks fledged.

One adult White-throated Swallow was recaptured 3 years later and another 2 years later, and two others a few months later. All recaptures were in the same area, suggesting a high site fidelity in this species. None of the 33 chicks ringed has been recaptured to date.

The range and numbers of this species have increased in the Western Cape due to the widespread availability of impoundments and structures that can be used as nesting sites. The White-throated Swallow could be an interesting subject of more detailed studies.

Here is the text for this species in the first bird atlas project.

Kingfishers are colourful and interesting, and it is a great pleasure to hold one in the hand (Figure 1). Catching them also provides valuable data, and here longevity data will be highlighted (data that can only reliably be obtained from ringing efforts).

There are 10 species in southern Africa, and the greatest longevity record is nearly 9 years, for a Brown-hooded Kingfisher, followed closely by Woodland and Giant Kingfishers both at 8 years. The most ringed kingfisher species is the Malachite Kingfisher, followed by Brown-hooded Kingfisher and African Pygmy Kingfisher, all species with over 2400 individuals ringed. The other kingfishers have less than 900 ringed each, with the rarer Mangrove Kingfisher at only 12 ringed. No Mangrove Kingfishers have been recaptured nor found dead, so this kingfisher has no longevity record.
The longevity for the African Pygmy Kingfisher is not high, being close to 4 years. Partly this could be due to it being an intra-African migrant, and it is not retrapped often. The greatest distance moved for this species (based on ringing data) is 433 km, between Durban and East London. Kingfishers in Europe have reached an age of 21 years, which is substantially more than records for African kingfishers, possibly due to more ringing in Europe and greater efforts to recapture these birds. This shows that there is potential for much greater longevities in our kingfishers, especially as African birds usually reach higher ages than similar species in Europe.
One of the kingfishers with the most number of recaptures was bird E16147 (Figure 2), ringed as an adult along the Ottery River in Cape Town, and recaptured 11 times thereafter, and becoming the oldest known Malachite Kingfisher. Unfortunately the ringing site was abandoned after the site deteriorated (dumping of rubble, and other factors), else the longevity record may have been a few years more by now (if the same bird was still alive and being caught). This also highlights the threat of habitat loss to kingfishers, and Malachite Kingfishers are sadly declining in southern Africa.

Table 1. Longevity records for the southern African kingfisher species
| Species | Longevity | Ring no. |
|---|---|---|
| Malachite Kingfisher | 6y 5m | E16147 |
| Brown-hooded Kingfisher | 8y 11m | E44060 |
| African Pygmy Kingfisher | 3y 11m | Y00280 |
| Woodland Kingfisher | 8y 0m | E34901 |
| Pied Kingfisher | 5y 11m | 423533 |
| Grey-hooded Kingfisher | 5y 0m | 4A39419 |
| Giant Kingfisher | 8y 0m | PA04160 |
| Half-collared Kingfisher | 4y 1m | E31580 |
| Striped Kingfisher | 3y 7m | E07527 |
| Mangrove Kingfisher | n/a |
Would you like to ring a kingfisher? Book a trip with African Ringing Expeditions!
Wairasho PS. 2019. Dwarf ravens kill and eat a spotted thick-knee – previously undocumented behavior of the dwarf raven or Somali crow. Biodiversity Observations 10.7:1-8
Biodiversity Observations is an open access electronic journal published by the Animal Demography Unit at the University of Cape Town. This HTML version of this manuscript is hosted by the Biodiversity and Development Institute. Further details for this manuscript can be found at the journal page, and the manuscript page, along with the original PDF.
The dwarf raven or Somali crow (Corvus edithae) is an endemic resident in Eritrea, Ethiopia, Somali, Kenya and SE Sudan (Fry et al. 2000). In Kenya they are locally found mostly in the North from around Kapedo, Laisamis, Mado Gashi and Wajir areas. These birds belong to the family Corvidae. They are medium to large passerine birds. They are conspicuous, bold, inquisitive and highly adaptable. As a family they occupy a wide range of habitats including forest, woodland, grassland, tundra, desert and cliffs but more often around human habitation (Fry et al. 2000).
This species, in particular, inhabits deserts, semi-deserts, arid plains, dry savannas and open thorn bush from sea level to around 2000 m ASL (Fry et al. 2000). Their general behavior is not well documented but they are known to be solitary or to live in pairs and in flocks of up to 100 in the non-breeding season. They are usually fearless and aggressive.
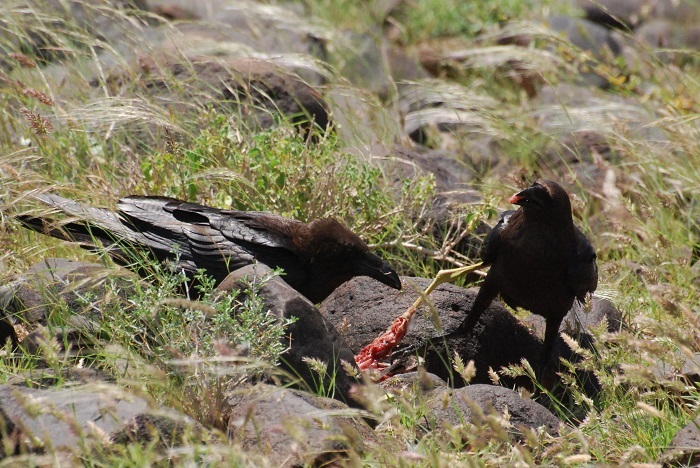
Their food consists of small ground-dwelling animals, carrion, some plants, bird eggs, ticks and lice (Fry et al. 2000). They are largely considered to be scavengers. Thus, while at Turkana in May 2018 I was surprised to witness a small group of the species behave like raptors in pursuit of their prey. A group of three dwarf ravens landed about 50 m from where I was standing, and began rummaging through small dry bushes (Figures 1 and 2).


I had not even taken much notice of two fully-grown spotted thick-knees (Burhinus capensis) nearby (Figure 3), thanks to their cryptic plumage which blended well with the surroundings: sun-bleached volcanic rocks spewed all over this vast arid region interspersed by short dry grass and bushes.

Before long, I noticed something emerge fast from the short bushes, apparently disturbed by the ravens. It was a young spotted thick-knee (Figure 4), not fully grown but just as tall as the parents, who were close by.

The ravens actively pursued the young thick-knee (Figure 5), caught it and relentlessly attacked it (Figures 6, 7, 8, 9).


The attack was briefly interrupted when Egyptian vultures (Neophron percnopterus) landed nearby (Figure 10) and again when a white-headed vulture (Trigonoceps occipitalis) landed nearby (Figure 11).


The parents of the young thick-knee watched from a safe distance away and made no attempts to rescue the fledgling. Eventually the ravens killed the thick-knee before proceeding to dismember it and devour it (Figure 12).

We could not find other records of Corvids actively hunting and killing live prey but it is likely desert dwelling corvids will often resort to catching live prey (of any taxa).
Many thanks to Dr Peter Njoroge for his advice in the presentation of this record.
Fry CH, Keith S, and Urban EK (Eds). 2000. The Birds of Africa Vol. VI Academic Press, London.
Checklist of the Birds of Kenya, Fourth Edition, OS-c EANHS September 2009.

de Castro J, and de Castro M. 2019. Mad buffalo. Biodiversity Observations 10.6:1-9
Biodiversity Observations is an open access electronic journal published by the Animal Demography Unit at the University of Cape Town. This HTML version of this manuscript is hosted by the Biodiversity and Development Institute. Further details for this manuscript can be found at the journal page, and the manuscript page, along with the original PDF.
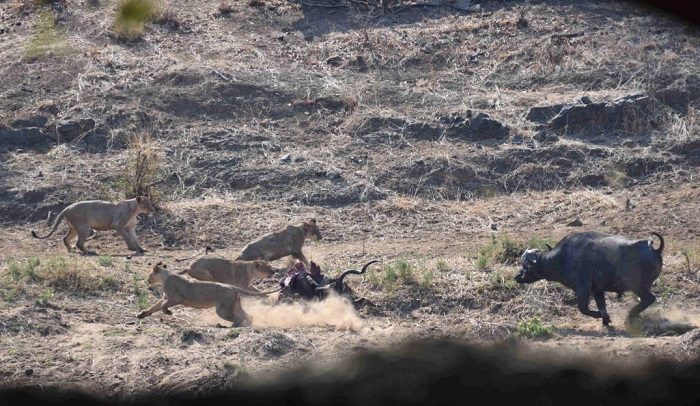
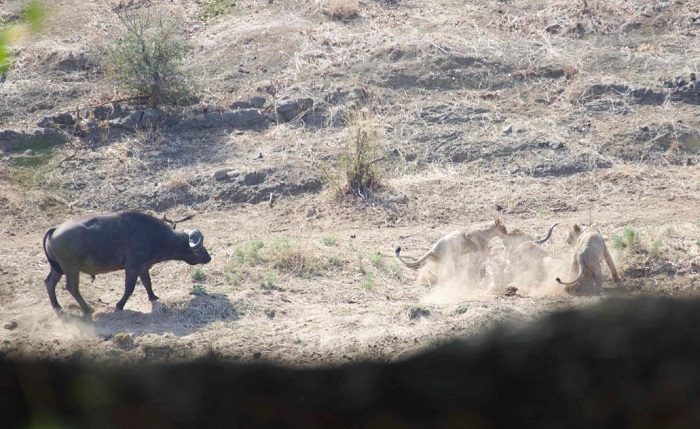
We were on a game drive following the Shingwedzi River towards the Kanniedood Dam in the Kruger National Park on 5 October 2017. About four km after leaving the Shingwedzi Rest Camp we spotted a group of lions feeding on a greater kudu that appeared to have been killed earlier that morning (Figure 1). It was 08h30.

There were ten lions: two adult males, one young male, and seven adult females. They were feeding on the opposite bank of the river. Although the latter was open sand banks with scattered bushes, our visibility was rather limited by the dense vegetation on our side. After a while we managed to find a gap in the vegetation that enabled us to watch them.
At exactly 08h45 (we know the exact times because of the photo timestamps) four lionesses were feeding on the kill while the remaining members of the pride were nearby, either a few metres away or up on the river bank. We also noted that there were three adult buffalo about 50 metres towards the right of the lions. They were not grazing, just watching them.
Suddenly, one of the buffalo ran the distance that separated it from the lions at speed and charged the group, scattering them in all directions (Figure 2). Then the buffalo started to head-butt the greater kudu carcass.
The buffalo thrashed the carcass for a few seconds. During this time, the lions dispersed a short distance and then stopped and watched the buffalo (Figures 3 – 5).


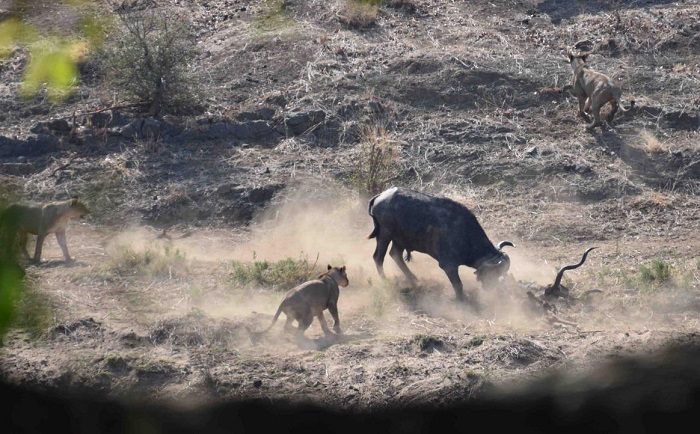
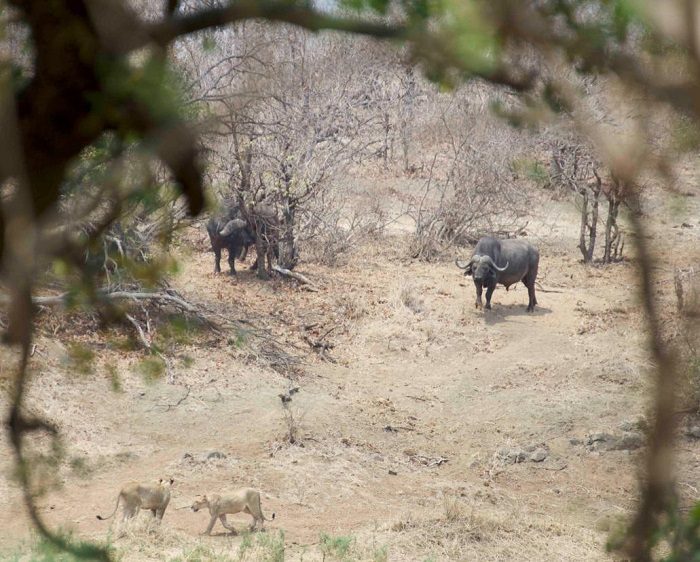
Then, the other two buffalo came and the trio stood at the site for a while before moving off to the other side of the carcass at a distance of about 30 metres (Figures 6 and 7).

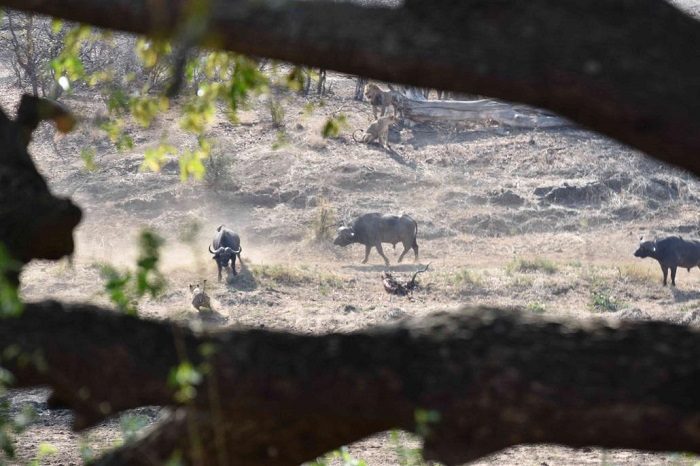
Two minutes later the lions started to come back and resumed feeding, still being watched by the buffalo. Several lion came to feed and left, including the males. After thirty minutes, six lionesses were feeding at the kill (Figure 8) when a second buffalo charge took place (Figures 9 and 10).


This time the buffalo only displaced the lions and it did not interfere with the carcass (Figure 11).

After this second interaction the three buffalo turned their attention towards the lions that were now away from the carcass and proceeded to flush them out from the locations the lions chose as cover (Figure 12).
After about one hour of this confrontation, one of the lionesses moved off and walked about 200m towards a pool in the river and, after drinking, took cover under some bushes.
By about 11h00 the standoff was over and the buffalo moved away leaving the lions undisturbed either singly or in small groups at various places along the river. When we returned before sunset, a group of lions was resting on the riverbed but the buffalo were no longer in the area. By the following morning there were no signs of the lions or the carcass but some buffalo were still in the area.
We believe that there are three issues of interest. The first is that at no time the lions attempted to face or retaliate against the buffalo despite the size of the pride. This is probably explained either by not being hungry (as they had fed on the grater kudu) and/or being aware that the strong buffalo were a dangerous prey.
The second issue is the clear and understandable adverse reaction of the buffalo against the lions that they perceive as a danger and did not wish to have in their territory.
The third issue relates to the buffalo behaviour towards the carcass. It is possible that, unable to retaliate against the lions, the buffalo’s anger was expressed against what they saw as associated with the predators. Of course we cannot rule out that some other reason sight- or smell-related, triggered this conduct.
Perhaps readers with more experience on animal behaviour would like to comment on this and put forward a better explanation?

Lerm RE, Jansen R, and Underhill LG. 2019. Bird distribution dynamics – Indigenous francolins in South Africa, Lesotho, and Swaziland. Biodiversity Observations 10.5:1-31
Biodiversity Observations is an open access electronic journal published by the Animal Demography Unit at the University of Cape Town. This HTML version of this manuscript is hosted by the Biodiversity and Development Institute. Further details for this manuscript can be found at the journal page, and the manuscript page, along with the original PDF.
The objective of this series of papers on bird distribution dynamics in Biodiversity Observations is to report on the ranges of bird species as revealed by the Second Southern African Bird Atlas Project (SABAP2, 2007 onwards) and to describe how their ranges have changed since the first bird atlas (SABAP1, mainly 1987-1991), about two decades apart.
This series of papers is also made feasible by the development of two new standards for the presentation of maps, firstly pentad-scale distribution maps derived from SABAP2 data, and secondly range-change maps showing how distributions have changed between SABAP1 and SABAP2 (Underhill & Brooks 2016a, b). Because the papers in this series use these two new interpretations in the form of maps, the rules for interpretation are not provided in detail in each of the “bird distribution dynamics” paper series.
Here, we deal with some of the economically important species of cursorial gamebirds belonging to the order Galliformes (family Phasianidae), that occur in South Africa, Lesotho and Swaziland. For each species, four items of information are presented: the SABAP1 distribution map using quarter-degree grid cells, the SABAP2 distribution map, using pentads (five-minute grid cells; there are nine pentads per quarter-degree grid cell), the range-change map, showing estimated changes in relative abundance between SABAP1 and SABAP2, and a table which provides counts of the numbers of grid cells shaded each of the six colours in the range change map.
The six terrestrial gamebird species dealt with are divided under the genera: Peliperdix, Dendroperdix and Scleroptila. Unfortunately, most of these francolin species are cryptic and inconspicuous making field identification difficult however, since citizen scientists were the source of observers across both SABAPs, possible errors in reporting rates should be similar for both projects. We expect that at least the more important range-change maps depict accurate changes in bird distribution.
Additionally, and compared to previous papers in this series, the national land cover dataset (GeoTerraImage 2015), and biomes and bioregions according to Mucina and Rutherford (2006) were underlying the range-change data to get some insights into which habitats might have influenced decreases and increases in species distributions.
Of the global extant francolin species (n=14) belonging to the aforementioned genera, 21% (n=3) are in a global threat category: in this case all ‘Near-threatened’. These Red-listed species belong to the Scleroptila genus and occur mostly in East Africa with sub-populations of one species remaining in Cameroon {West Africa; BirdLife International (2018) IUCN Red List for birds. Downloaded from http://www.birdlife.org on 14/02/2018}.
In South Africa, pressure from wing shooters and livestock grazing around the earlier 1900s caused certain populations of gamebirds in South Africa to survive where others did not, resulting in fragmented populations or local extinctions. However, species such as grey-winged francolin Scleroptila africanus, increased in the Eastern Cape grassland following the inland settlement by European farmers. Past introductions of foreign gamebirds have fortunately and, for some reason (possibly due to blood parasites) been unsuccessful (Little and Crowe 2011).
The assessment of changes in abundance for the species discussed here (from SABAP1 to SABAP2) is not further complicated by migratory habits, due to their mostly resident statuses. The species accounts are ordered in ascending Roberts number order as published by Hockey et al. (2005).
The range-change map (Figure 4) of this highly localised gamebird raised concern due to very large and widespread decreases (57-60% of grid cells where it was recorded) across most of its core distribution range that falls broadly within South Africa’s Savanna Biome (Mucina & Rutherford 2006). Since SABAP1, this species’ distribution seemed to shift towards biomes containing habitats that are more diverse in vegetation structure and land-use compared to its favoured tall-grassed and open woodland habitats. Where this species historically avoided agricultural fields (Little 2005a), the GeoTerra Image (2015) land cover dataset of 2013-2014 showed Coqui francolin Peliperdix coqui (Figure 1) might prefer a mix of low intensity, cultivated commercial fields interspersed with grassland. This increase was especially noticeable around the intersections between North-West, Free State and Gauteng provincial boundaries.


Table 1. Range-change summary for the Coqui francolin between SABAP1 and SABAP2. Numbers (and percentages) in each colour category of Figure 4, for which there are at least four checklists per quarter degree grid cell in both SABAP1 and SABAP2. Also shown are the same summaries when the analysis is restricted to grid cells with at least 30 checklists for both SABAP1 and SABAP2.
| 4+ checklists | 30+ checklists | |||
|---|---|---|---|---|
| Status | Count | % | Count | % |
| Red (very large decrease) | 208 | 57 | 129 | 60 |
| Orange (large decrease) | 37 | 10 | 25 | 12 |
| Yellow (small decrease) | 29 | 8 | 15 | 7 |
| Light green (small increase) | 10 | 3 | 6 | 3 |
| Dark green (large increase) | 17 | 5 | 10 | 5 |
| Blue (very large increase) | 66 | 18 | 29 | 14 |
| Total | 367 | 100 | 214 | 100 |
This species showed approximately equal portions of increases and decreases in its distribution across the northern parts of South Africa (Table 2). Decreases could have been associated across crested francolin Dendroperdix sephaena (Figure 5) distribution to a multitude of land covers including plantations, orchards, thicket, urban areas and high intensity commercial agriculture. The northern half of the Gauteng Province showed increases mostly in urban areas, wooded habitats and low to medium intensity commercial agricultural fields interspersed with grassland (GeoTerra Image, 2015). As with the Coqui francolin, the crested francolin seemed to shift its distribution towards the Kalahari (Westerly) where low shrubland, subsistence and low intensity commercial agriculture and, open woodland form a heterogeneous landscape. This shared preference for habitats with the former species, has been reported before by Little (2005b).


Table 2. Range-change summary for the crested francolin between SABAP1 and SABAP2. Numbers (and percentages) in each colour category of Figure 8, for which there are at least four checklists per quarter degree grid cell in both SABAP1 and SABAP2. Also shown are the same summaries when the analysis is restricted to grid cells with at least 30 checklists for both SABAP1 and SABAP2.
| 4+ checklists | 30+ checklists | |||
|---|---|---|---|---|
| Status | Count | % | Count | % |
| Red (very large decrease) | 49 | 13 | 18 | 10 |
| Orange (large decrease) | 75 | 20 | 43 | 23 |
| Yellow (small decrease) | 61 | 16 | 35 | 19 |
| Light green (small increase) | 45 | 12 | 24 | 13 |
| Dark green (large increase) | 81 | 21 | 32 | 17 |
| Blue (very large increase) | 67 | 18 | 32 | 17 |
| Total | 378 | 100 | 184 | 100 |
Very large decreases were visible across the ‘Cape provinces’ and KwaZulu-Natal (46-51% cells where the species was recorded; Figure 12; Table 3). In the Western Cape Province these areas were characterised by GeoTerra Image (2015) as high intensity cultivated commercial fields, vineyards and urbanisation with increases towards the North into the Karoo’s low shrubland and bare soils (Figure 12). The decreases elsewhere across the Eastern Cape and KwaZulu-Natal seemed to be in areas where sparse commercial cultivated fields of low intensity or plantations/woodland were present. The largest increases in distribution for grey-winged francolin Scleroptila africanus (Figure 9) was distributed across the boundaries of the Free State and Mpumalanga Provinces of South Africa. Here, high-density commercial cultivated fields of low to medium intensity, dominated the historically grassland landscape. What the GeoTerra Image remote sensing product could not tell us was whether domestic livestock grazing has impacted on changes in distribution of this species. We may only assume that remnant grasslands where decreases took place across the Mpumalanga Province are associated with livestock (Jansen et al. 1999).


Table 3. Range-change summary for the grey-winged francolin between SABAP1 and SABAP2. Numbers (and percentages) in each colour category of Figure 12, for which there are at least four checklists per quarter degree grid cell in both SABAP1 and SABAP2. Also shown are the same summaries when the analysis is restricted to grid cells with at least 30 checklists for both SABAP1 and SABAP2.
| 4+ checklists | 30+ checklists | |||
|---|---|---|---|---|
| Status | Count | % | Count | % |
| Red (very large decrease) | 263 | 46 | 141 | 51 |
| Orange (large decrease) | 76 | 13 | 50 | 18 |
| Yellow (small decrease) | 42 | 7 | 22 | 8 |
| Light green (small increase) | 29 | 5 | 13 | 5 |
| Dark green (large increase) | 34 | 6 | 10 | 4 |
| Blue (very large increase) | 128 | 22 | 43 | 15 |
| Total | 572 | 100 | 279 | 100 |
Across this species’ distribution range, widespread and very large decreases were evident since the first SABAP (Figure 16). These contiguous areas of decreased reporting rates such as central to north-eastern Mpumalanga, contained massive areas under exotic plantations and dense woodland or thicket (GeoTerra Image 2015). Other land covers appearing within these quarter degree grid cells are grasslands interspersed with woodland, plantations and orchards. Northern Kruger National Park also showed widespread but, very large decreases since SABAP1 and these were characterised by contiguous patches of thicket or denser woodland with some very large increases where grassland was more dominant towards the central parts of the park. Western KwaZulu-Natal showed the largest contiguous area of very large increases since SABAP1 (Figure 16). Here, a mosaic of land cover classes was evident across the grid cells where grassland dominated but with some areas covered by urbanisation (formal and informal), villages, medium intensity agriculture and woodland. Across South Africa, areas containing at least some grassland patches among woodland showed to host more Shelley’s francolin Scleroptila shelleyi (Figure 13) than other areas, as reported before by Little (2005c).


Table 4. Range-change summary for the Shelley’s francolin between SABAP1 and SABAP2. Numbers (and percentages) in each colour category of Figure 16, for which there are at least four checklists per quarter degree grid cell in both SABAP1 and SABAP2. Also shown are the same summaries when the analysis is restricted to grid cells with at least 30 checklists for both SABAP1 and SABAP2.
| 4+ checklists | 30+ checklists | |||
|---|---|---|---|---|
| Status | Count | % | Count | % |
| Red (very large decrease) | 179 | 59 | 122 | 59 |
| Orange (large decrease) | 34 | 11 | 27 | 13 |
| Yellow (small decrease) | 18 | 6 | 12 | 6 |
| Light green (small increase) | 15 | 5 | 10 | 5 |
| Dark green (large increase) | 15 | 5 | 12 | 6 |
| Blue (very large increase) | 42 | 14 | 25 | 12 |
| Total | 303 | 100 | 208 | 100 |
A species sensitive to overgrazing and frequent burning, the effects of these land-use practices result in local population collapses due to changes in habitat quality and quantity (Jansen et al. 1999; Jansen et al. 2000; Jansen et al. 2001). Where the uKhahlamba-Drakensberg Park, KwaZulu-Natal Province used to be a South African stronghold for red-winged francolin Scleroptila levaillantii (Figure 17, 18; Little 2005), SABAP range-change data showed that large to very large decreases took place since 1991. However, very large decreases in grid cells were widespread and clustered across the species’ relatively small South African distribution (Table 5). Generally, land covers such as dense commercial agriculture of various intensity and bare mines among grasslands were areas that showed the largest decreases (Figure 20). Along the eastern to southern coast of South Africa and down to the Western Cape, thicket, woodland, exotic plantations, high intensity commercial agriculture and urbanisation seemed to drive lowered reporting rates. Across central Mpumalanga, large to very large increases in distribution seemed to be associated with the same land covers where large decreases (Free State, South-Western Mpumalanga and Eastern Cape) took place except for the lowered agricultural intensity that dominated this area of increased reports. A possibility for this anomaly might be increased livestock grazing in provinces where very large decreases were seen. As mentioned before, grazing intensity on grassland systems could not be identified using GeoTerra Image (2015) remote sensing product and may well be a confounding factor in some of the grassland-covered areas. The land cover dataset also does not show burnt areas hence, these two important components driving red-winged francolin populations might well have been the cause of country-wide declines, especially across the interior of South Africa where livestock grazing is prominent.


Table 5. Range-change summary for the red-winged francolin between SABAP1 and SABAP2. Numbers (and percentages) in each colour category of Figure 20, for which there are at least four checklists per quarter degree grid cell in both SABAP1 and SABAP2. Also shown are the same summaries when the analysis is restricted to grid cells with at least 30 checklists for both SABAP1 and SABAP2.
| 4+ checklists | 30+ checklists | |||
|---|---|---|---|---|
| Status | Count | % | Count | % |
| Red (very large decrease) | 172 | 50 | 111 | 46 |
| Orange (large decrease) | 43 | 12 | 36 | 15 |
| Yellow (small decrease) | 21 | 6 | 16 | 7 |
| Light green (small increase) | 13 | 4 | 10 | 4 |
| Dark green (large increase) | 27 | 8 | 22 | 9 |
| Blue (very large increase) | 70 | 20 | 44 | 18 |
| Total | 346 | 100 | 239 | 100 |
Found predominantly across central South Africa, Botswana and Namibia, the Orange River francolin Scleroptila levaillantoides (Figure 21) prefers grassland habitats in certain parts of its range or the presence of woody plants and cultivated fields in other areas (Little and Crowe 2011). Although this is the only species discussed here that showed large to very large increases across ~50% of its distribution (Table 6), there were few, clustered large to very large decreases across its South African range. It was not clear why these decreases were centred around the Eastern Kalahari Bushveld Bioregion (Mucina and Rutherford 2006) as low shrubland, grassland, and the presence of woody plants seemed to be associated with these drastic changes. Towards the East of the country, commercial agriculture was dominant across grid cells that showed very large decreases as well as very large increases. One possible explanation for this unique pattern across South Africa could be that livestock grazing (not evident from the remote sensing products used here) determined the presence of this species in an area where high intensity grazing could have resulted in modifying grassland structure to such a degree rendering certain areas unfavourable for Orange River francolin. Contrary to the above pattern, this species’ north-eastern distribution across the Mpumalanga, Free State, Gauteng and North-West Provinces seemed to be a large contiguous area of large to very large increases (Figure 24). This area was characterised by low to medium intensity commercial agriculture, a multitude of wetlands and grassland habitat, all in approximately equal proportions across the landscape. Another area near the boundaries of the Free State and Northern Cape Provinces showed very large increases in distribution of this species. Here, low shrubland dominated but was interspersed with the Orange River francolin’s favoured habitat across its range: grassland.


Table 6. Range-change summary for the Orange River francolin between SABAP1 and SABAP2. Numbers (and percentages) in each colour category of Figure 24, for which there are at least four checklists per quarter degree grid cell in both SABAP1 and SABAP2. Also shown are the same summaries when the analysis is restricted to grid cells with at least 30 checklists for both SABAP1 and SABAP2.
| 4+ checklists | 30+ checklists | |||
|---|---|---|---|---|
| Status | Count | % | Count | % |
| Red (very large decrease) | 87 | 23 | 17 | 13 |
| Orange (large decrease) | 36 | 9 | 13 | 10 |
| Yellow (small decrease) | 28 | 7 | 10 | 8 |
| Light green (small increase) | 36 | 9 | 14 | 11 |
| Dark green (large increase) | 47 | 12 | 14 | 11 |
| Blue (very large increase) | 149 | 39 | 58 | 46 |
| Total | 383 | 100 | 126 | 100 |
This paper is part of a series, which celebrates the contributions of thousands of citizen scientists to the databases of the first and second bird atlas projects in Southern Africa (SABAP1 and SABAP2). From 2007 to March 2017, SABAP2 (Underhill 2016) was a partnership project of SANBI (South African National Biodiversity Institute), BirdLife South Africa and the Animal Demography Unit in the Department of Biological Science at the University of Cape Town.
Crowe TM, Harley EH, Jakutowicz MB, Komen J, Crowe AA 1992. Phylogenetic, Taxonomic and Biogeographical Implications of Genetic, Morphological, and Behavioral Variation in Francolins (Phasianidae: Francolinus). The Auk 109.1:24-42
GeoTerra Image 2015. 2013-2014 South African National Land-cover dataset. Pretoria
Hockey PAR, Dean WRJ, Ryan PG (eds) 2005. Roberts Birds of Southern Africa, VIIth edition. The Trustees of the John Voelcker Bird Book Fund, Cape Town
Jansen R, Little RM, Crowe TM 1999. Implications of grazing and burning grasslands on the sustainable use of francolins (Francolinus spp.) and on overall bird conservation in the highlands of Mpumalanga Province, South Africa. Biodiversity and Conservation 8:587-602
Jansen R, Little RM, Crowe TM 2000. Habitat utilization and home range of the redwing francolin, Francolinus levaillantii, in highland grasslands, Mpumalanga Province, South Africa. African Journal of Ecology 38:329-338
Jansen R, Robinson ER, Little RM, Crowe TM 2001. Habitat constraints limit the distribution and population density of redwing francolin, Francolinus levaillantii, in the highland grasslands, Mpumalanga Province, South Africa. African Journal of Ecology 39:146-155
Little RM 2005a. Coqui Francolin Peliperdix coqui. In: Hockey PAR, Dean WRJ, Ryan PG (eds) 2005. Roberts Birds of Southern Africa, VIIth edition. pp. 79-80. The Trustees of the John Voelcker Bird Book Fund, Cape Town
Little RM 2005b. Crested Francolin Dendroperdix sephaena. In: Hockey PAR, Dean WRJ, Ryan PG (eds) 2005. Roberts Birds of Southern Africa, VIIth edition. pp. 63-64. The Trustees of the John Voelcker Bird Book Fund, Cape Town
Little RM 2005c. Shelley’s Francolin Scleroptila shelleyi. In: Hockey PAR, Dean WRJ, Ryan PG (eds) 2005. Roberts Birds of Southern Africa, VIIth edition. pp. 66-67. The Trustees of the John Voelcker Bird Book Fund, Cape Town
Little RM 2005d. Red-winged Francolin Scleroptila levaillantii. In: Hockey PAR, Dean WRJ, Ryan PG (eds) 2005. Roberts Birds of Southern Africa, VIIth edition. pp. 65-66. The Trustees of the John Voelcker Bird Book Fund, Cape Town
Little RM, Crowe TM 2011. Gamebirds of Southern Africa. Struik Nature, Cape Town
Mucina L, Rutherford MC 2006. The vegetation of South Africa, Lesotho and Swaziland. South African National Biodiversity Institute.
Ratcliffe CS 2005. Chukar Partridge Alectoris chukar. In: Hockey PAR, Dean WRJ, Ryan PG (eds) 2005. Roberts Birds of Southern Africa, VIIth edition. pp. 61-62. The Trustees of the John Voelcker Bird Book Fund, Cape Town
Underhill LG 2016. The fundamentals of the SABAP2 protocol. Biodiversity Observations 7.42:1-12. Available online at http://bo.adu.org.za/content.php?id=235
Underhill LG, Brooks M 2016a. Pentad-scale distribution maps for bird atlas data. Biodiversity Observations 7.52:1-8. Available online at http://bo.adu.org.za/content.php?id=245
Underhill LG, Brooks M 2016b. Displaying changes in bird distributions between SABAP1 and SABAP2. Biodiversity Observations 7.62:1-13. Available online at http://bo.adu.org.za/content.php?id=255
Viljoen PJ 2005. AGRED’s Gamebirds of South Africa: field identification and management. African Gamebird Research Education and Development Trust, Johannesburg

Arbon K. 2019. Predation of porcupine Hystrix africaeaustralis in the den by honey badger Mellivora capensis. Biodiversity Observations 10.4:1-3
Biodiversity Observations is an open access electronic journal published by the Animal Demography Unit at the University of Cape Town. This HTML version of this manuscript is hosted by the Biodiversity and Development Institute. Further details for this manuscript can be found at the journal page, and the manuscript page, along with the original PDF.
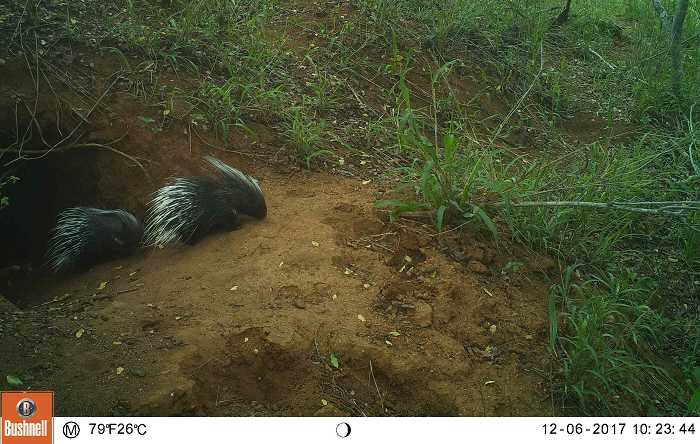
One morning in late November 2017, observers passing a known porcupine (Hystrix africaeaustralis) den witnessed an adult porcupine entering followed by a juvenile (‘porcupette’). We set a camera trap (Bushnell Trophy Cam Essential 119636) to observe the entrance of the den, and from this we learned there were in fact two resident porcupettes (Figure 1).
The camera trap recorded the coming and going of two adults several times over the following days. Then on the night of 6 December 2017 a male honey badger (Mellivora capensis) was seen visiting the den several times. It first entered the den at 23:20 and left again 18 minutes later. At 23:49 it returned and entered a second time, emerging again after only 1 minute. It re-entered the den a third time at 00:02, staying inside until 00:18, at which time it emerged and apparently left the area.
At 02:35 an adult porcupine approached the den and stood outside the entrance for 1 minute, appearing to sniff the ground and edges of the entrance hole. It is not clear whether the porcupine then entered the den or if it left the area as its movement was not captured by the camera trap, which was set to trigger every 60 seconds.
At 03:20 a male honey badger, presumably the same individual, returned to the den a fourth time, and at 03:34 was photographed leaving the den with a porcupette in its jaws (Figure 2).

The honey badger did not return to the den after this, and the second porcupette was never seen again. Begg et al. (2003) observed honey badgers often consuming large prey items (mammals >100 g) inside burrows, so it is possible this individual may have eaten one porcupette inside the den in any of the three extended periods it spent underground, before taking the second away with it.
The two adult porcupines continued to utilise the den despite the loss of definitely one, presumably both, of their young, for another ten days. The den received three more visitors of interest – an African civet (Civetticus civetta) on 7 December 2017; a lioness (Panthera leo) on 8 December 2017; and a female leopard (Panthera pardus) on 14 December 2017. All three were recorded briefly sniffing at the den entrance but none made any attempt to investigate further and no interaction with a porcupine was seen.
The camera trap was removed on 24 December 2017, the last photograph of a porcupine adult having been recorded on 17 December 2017. In May 2018 an adult porcupine was again seen by a passing observer at the den, with two new young.
Begg C, Begg K, Du Toit J, Mills M 2003. Sexual and seasonal variation in the diet and foraging behaviour of a sexually dimorphic carnivore, the honey badger (Mellivora capensis). Journal of Zoology, 260(3):301-316.