
We lost all the data***. Now we need to be starting from scratch!
This is not such a crazy idea. It is so easy to think. I know that the Red-veined Dropwing has been recorded here. I won’t bother to take a photograph of that dropwing, even though it is sitting so beautifully over there, because I know someone has submitted it already.
If we taken this approach, then, as the years tick by, the database steadily gets to show its age. The distribution maps we produce for a species tend to be based on older and older records.
How can we measure the “age” of the OdonataMAP data for, say, South Africa, Lesotho and eSwatini? Here is a recipe, with four steps. (1) In each quarter degree grid cell, find the date of the latest record of each species. (2) Sort these dates and find the date in the middle (the statistician’s median). Half the species in the grid cell have been seen before this date, and half after. We want this date to be as recent as feasible. Because we are taking the date in the middle, the fact that some species were recorded as vagrants a century ago does not influence the “middle date”. (If we had used the “average date”, the very old dates would drag the answer back in time in a way that is not OK. The mean of 1920, 2005, 2015 is 1980, but the median, the date in the middle is 2005.) (3) Find the “middle dates” for all the grid cells with records in South Africa, Lesotho and eSwatini. (4) Sort all these dates, and find the date in the middle. This median of the medians measures the “age” of the data for this region. In half of the grid cells, half the species have been seen since this date. (Here is a video that presents the same ideas; it is in the BDI YouTube channel.)
How far in the past is this median of the medians? Right now, on 1 February 2021, this date is 16 December 2015. This is the median of the medians for all grid cells with OdonataMAP data in South Africa, Lesotho and eSwatini. That is 5 years and a month ago. In English, this means that in half of the grid cells with records, half of the species have been recorded in the past five year, and half are older than that.
Five years is getting near the limit. Once the most recent record of a species in a grid cell gets to be five years old, it cannot really be used as evidence in a law court that the species persists there. In a nutshell, the OdonataMAP data is just starting to get a bit long in the tooth, and we need to make a special effort, starting in 2021, to pull it up to date.
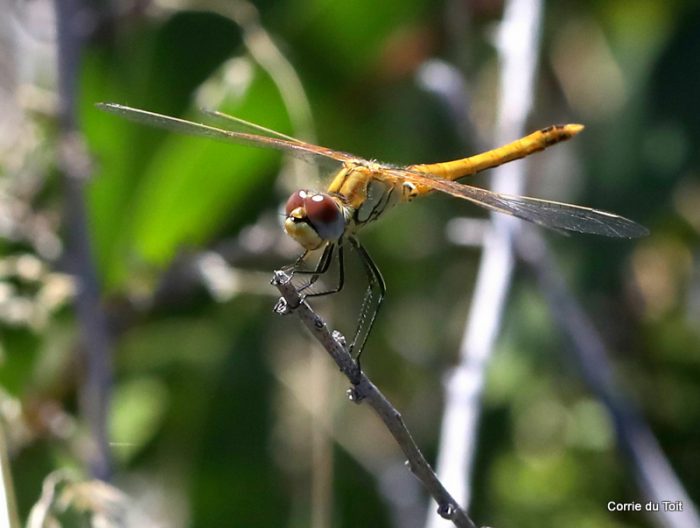
The best strategy for doing this is simply to act as if we need to start all over again. We especially need to focus on the common species! A great start was made on 1 January 2021, and this blog is illustrated with a few of the records collectedon this date. What follows is a set of maps, for the provinces of South Africa, which shows the number of species per grid cell, uploaded in the 29 days of 2021 AND identified to species level by the awesome OdonataMAP expert panel.
We start in the north, with Limpopo, and work our clockwise: Mpumalanga and Gauteng, KwaZulu-Natal, Eastern Cape, Western Cape, Northern Cape, Free State, and finally North West Province. On one hand, these maps show how much has been attained in only a month. On the other hand, they show how much there is to do!
[*** … of course we haven’t lost the data … but let’s work as if this is the truth!]
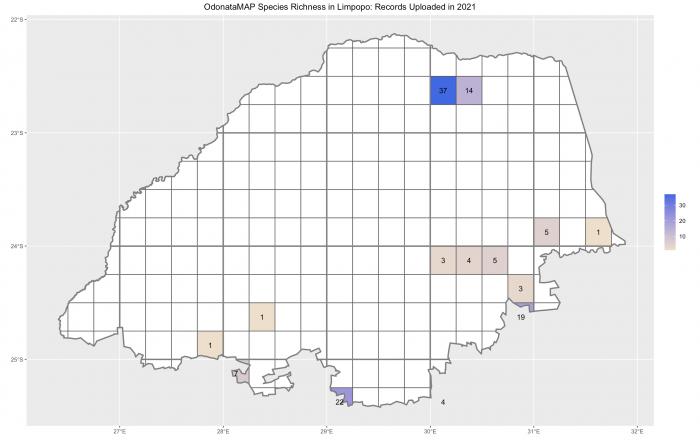
These are the grid cells in Limpopo with records uploaded in 2021. On 1 February 2021, for Limpopo overall, using the entire database, the the median of the medians was 6 March 2014. Half the records in half of the 170 grid cells with records are older than this. This means that the average age of the OdonataMAP data for Limpopo is 6 years 11 months, 21 months behind the average for the region!
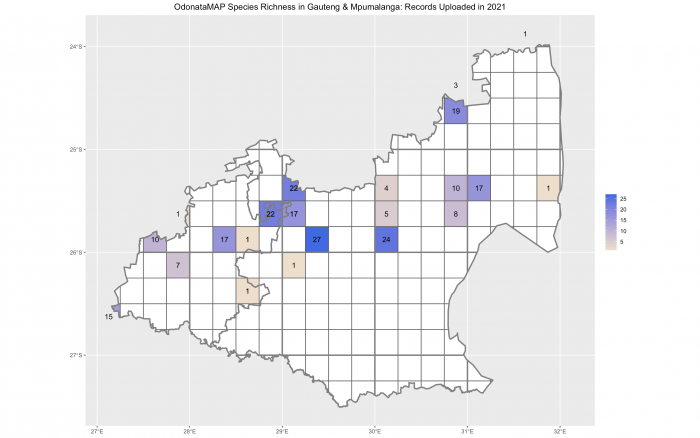
These are the grid cells in Mpumalanga and Gauteng with records uploaded in 2021 so far.
On 1 February 2021, for Mpumalanga as a whole, the median of the medians was 29 August 2014. Half the records in half of the 128 grid cells with records are older than this. This means that the average age of the OdonataMAP data for Mpumalanga is 6 years 5 months, 16 months behind the average for the region!
For Gauteng, the median of the medians was 4 February 2016. Half the records in half of the 42 grid cells with records are older than this. This means that the average age of the OdonataMAP data for Gauteng is almost exactly 5 years. So Gauteng is one month ahead of the average for the region!

These are the grid cells in KwaZulu-Natal with records uploaded in 2021 so far. Impressive! On 1 February 2021, for KwaZulu-Natal as a whole, the median of the medians was 23 March 2015. Half the records in half of the 169 grid cells with records are older than this. This means that the average age of the OdonataMAP data for KwaZulu-Natal is 5 years 1 month. This is only nine months behind the average for the region!
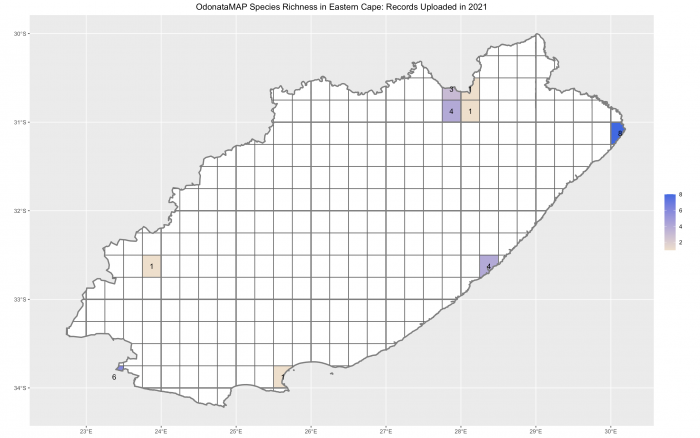
Only a handful of grid cells in the Eastern Cape have OdonataMAP records uploaded in 2021 so far. Impressive! On 1 February 2021, for Eastern Cape as a whole, the median of the medians was 5 November 2015. Half the records in half of the 181 grid cells with records are older than this. This means that the average age of the OdonataMAP data for Eastern Cape is 5 years and 3 months. This is only one month behind the average for the region! Well done to the Eastern Cape, and please keep the records pouring in.
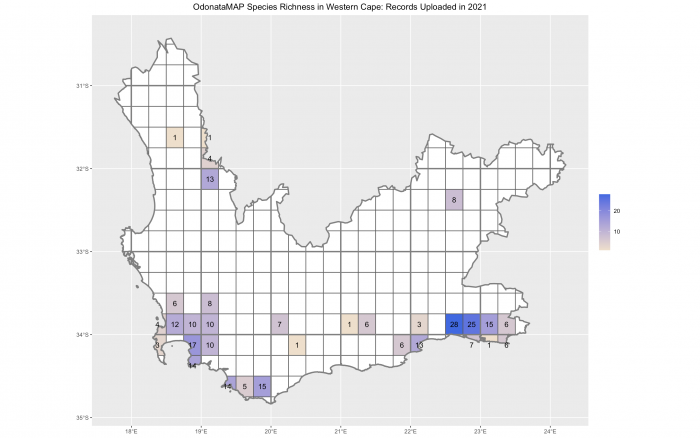
These are the grid cells in the Western Cape with records uploaded in 2021 so far. Impressive! On 1 February 2021, for the Western Cape as a whole, the median of the medians was 25 March 2017. Half the records in half of the 170 grid cells with records are older than this. This means that the average age of the OdonataMAP data for the Western Cape is 3 years and 10 months. This is 15 months ahead the average for the region! Great achievement to the OdonataMAPpers of the Western Cape.
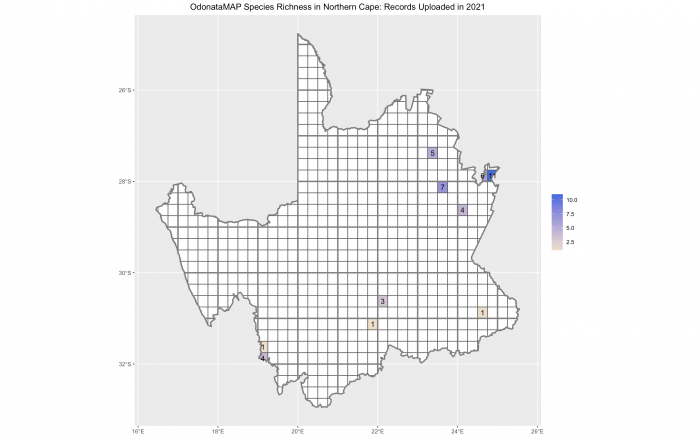
These are the grid cells in the Northern Cape with OdonataMAP records uploaded in 2021 so far. On 1 February 2021, for the Northern Cape as a whole, the median of the medians was 6 October 2017. Half the records in half of the 201 grid cells with records are older than this. This means that the average age of the OdonataMAP data for the Northern Cape is 3 years and 4 months. This is 22 months ahead of the average for the region! Of all the provinces, the Northern Cape has the most up-to-date database.
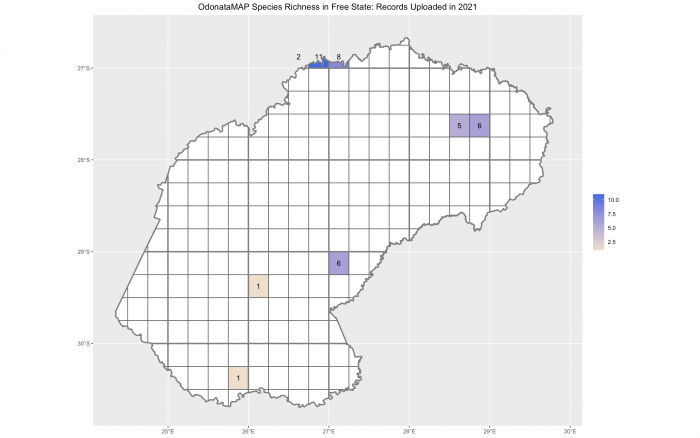
These are the handful of grid cells in the Free State with OdonataMAP records already uploaded in 2021 so far. On 1 February 2021, for the Free State as a whole, the median of the medians was 2 January 2015. Half the records in half of the 125 grid cells with records are older than this. This means that the average age of the OdonataMAP data for the Free State is 6 years and 1 month. This is 12 months behind the average for the region.
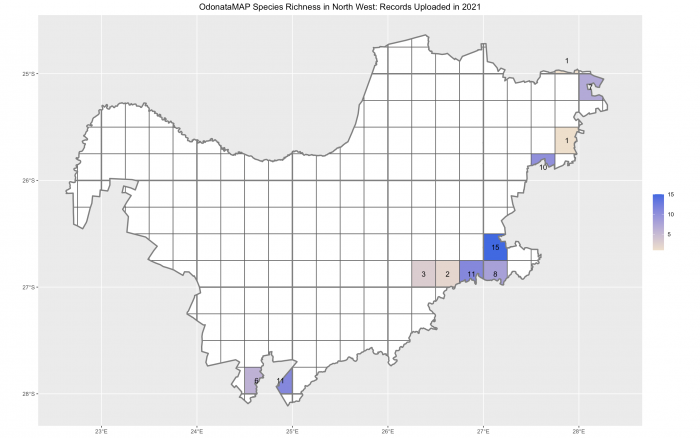
These are the grid cells in North West with OdonataMAP records already uploaded in 2021 so far. They are all along the southeastern border of the province! On 1 February 2021, for North West as a whole, the median of the medians was 6 December 2016. Half the records in half of the 78 grid cells with records are older than this. This means that the average age of the OdonataMAP data for North West is 4 years and 2 months. This is 12 months ahead of the average for the region.
So on 1 February 2021, the ordering of the provinces in terms of “up-to-dateness” is (1) Northern Cape (3.3 years), (2) Western Cape (3.9 years), (3) North West (4.2 years), (4) Gauteng (5.0 years), (5) Eastern Cape (5.2 years), (6) KwaZulu-Natal (5.9 years), (7) Free State (6.1 years), (8) Mpumalanga (6.4 years) and (9) Limpopo (6.9 years). The overall average against which these are compared is 5.1 years.
Of course, this is not the only ranking criterion. Aspects like percentage coverage, total numbers of records, and records per species-grid cell are also important. But for now the focus is on up-to-dateness. The hack to improve the up-to-dateness of a province is to “refresh” as many common species as possible in as many grid cells as possible. And this activity is precisely what helps to keep the distribution maps up to date.
So please adopt the mantra of “starting from scratch”. Please do upload everything, including the most common species, wherever you go, and especially in the grid cells with lots of data. These are the ones where it is easy to let up-to-dateness slip.
Acknowledgements
Rene Navarro developed the software used for these brand new measures up-to-dateness. Karis Daniel generated the maps. There would not be anything to write about without the contributions of the OdonataMAPpers. This is teamwork.
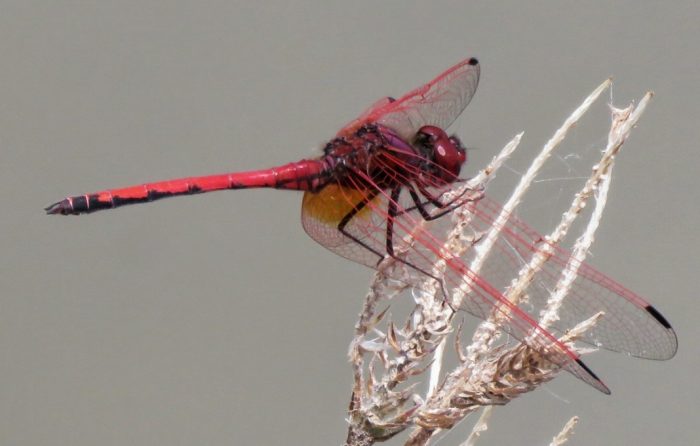
Thanks to Andries and Joey de Vries, Jaco Botes and Corrie du Toit for being out in the field on New Year’s Day and taking the photographs used to illustrate this blog.