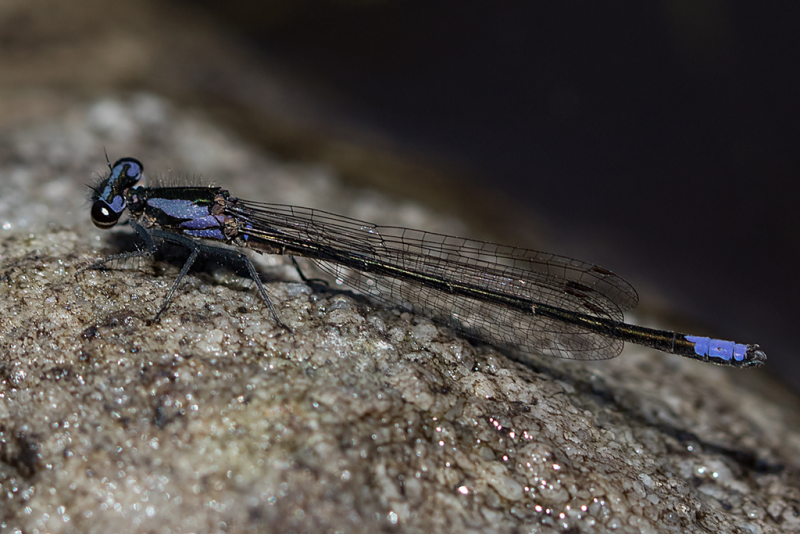
Cover photo of Spesbona by Gregg Darling.
Find the Ceres Streamjack in the FBIS database (Freshwater Biodiversity Information System) here.
Family Platycnemididae
Identification
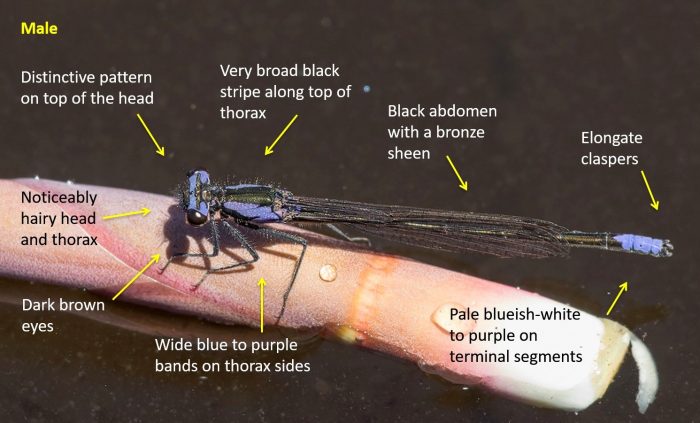
Theewaterskloof, Western Cape
Photo by Desire Darling
Very Small Size
Length up to 30mm; Wingspan reaches 38mm.
Both sexes of the Spesbona are dichromatic. Colouration varies according to temperature, ranging from blackish when cold to grey then blue, and finally mauve or purple when in full sun. Spesbona angusta is the only member of its genus.
Male Spesbonas are most likely to be mistaken for the Male Mauve Bluet (Proischnura polychromatica). Both show violet and black colouration, but the Spesbona is larger and more robust. The head of the Spesbona is violet with black postocular markings, while the head of the Mauve Bluet is black with purple postocular markings.
Click here for more details on identification.
Habitat
The Spesbona inhabits small pools connected to streams and meandering rivers. It favours sites with an abundance of overhanging grass, fynbos plants, and especially floating and emergent vegetation. The Spesbona is found mainly at altitudes of around 400m above sea level.

Photo by Sharon Stanton
Behaviour
The Spesbona typically sits lengthwise along a grass or reed stem, usually low down close to the water. When disturbed they fly low down over the water. Males and females are often found together but non-breeding individuals can also be found in dry grass a short distance from the water.
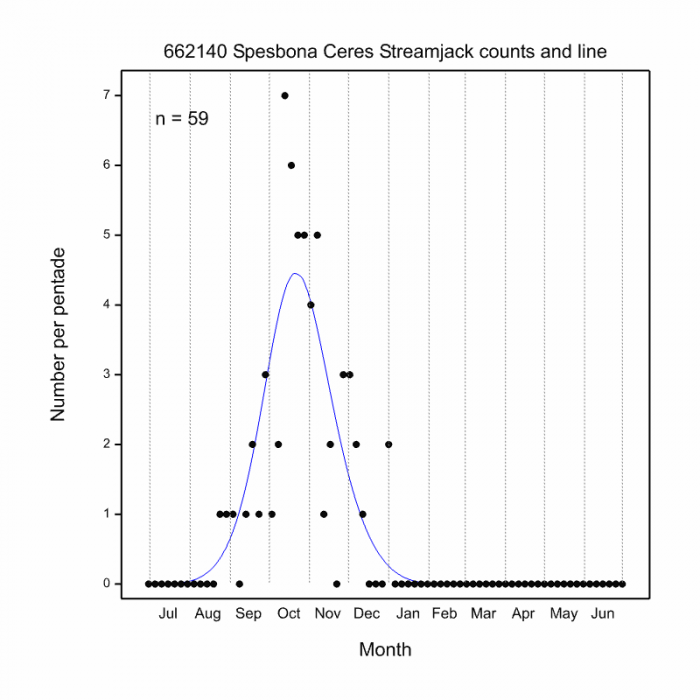
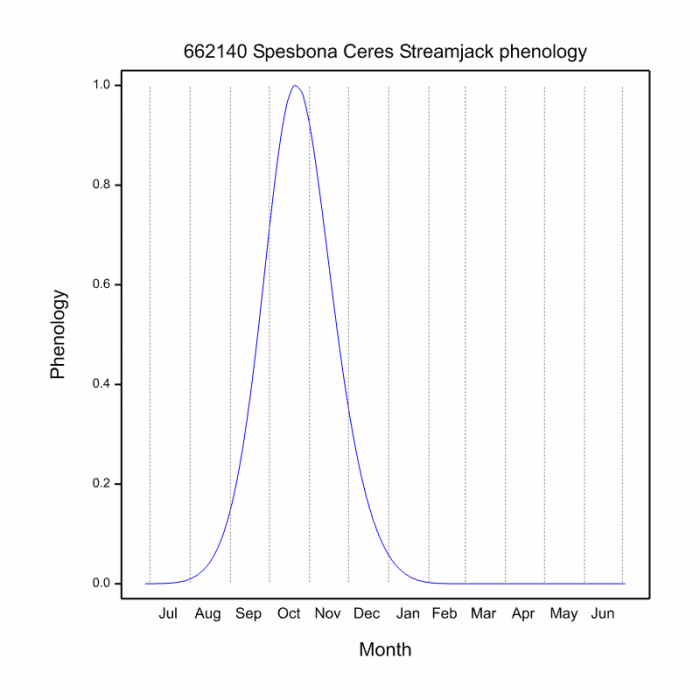
The Spesbona is on the wing from late August until the end of December. It is mainly an early-season species. See Phenology below.
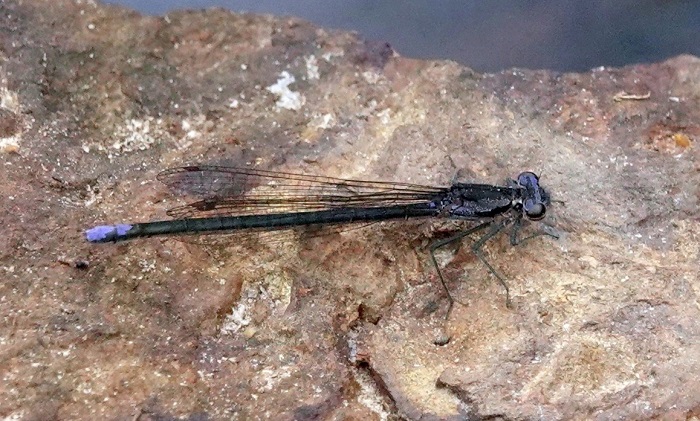
Nuwejaars Wetland, Western Cape
Photo by Les Underhill
Status and Conservation
The Spesbona is rare and very localised. It is listed as Endangered in the IUCN Red List of Threatened Species.
Distribution
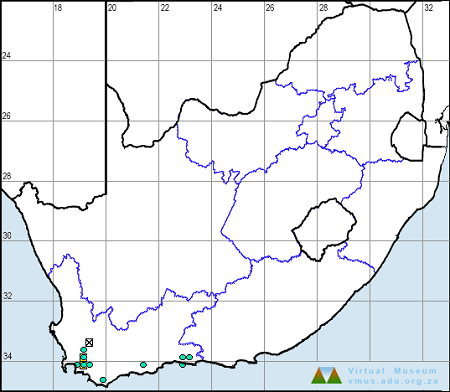
The species is endemic to the Western Cape, South Africa. It is likely to be more widespread than current records show. It was originally known only from near Ceres south to Franschhoek, but has now been found to also occur near Riversdale and in the Sedgefield/Knysna area.
Below is a map showing the distribution of records for Ceres Streamjack in the OdonataMAP database as at February 2020.
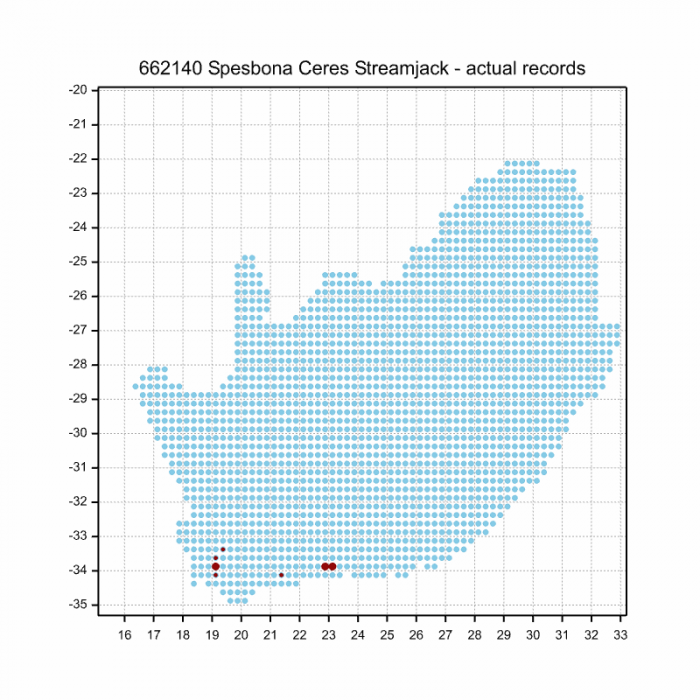
Below is a map showing the distribution of records for Ceres Streamjack in the OdonataMAP database as of December 2024.
The next map below is an imputed map, produced by an interpolation algorithm, which attempts to generate a full distribution map from the partial information in the map above. This map will be improved by the submission of records to the OdonataMAP section of the Virtual Museum.
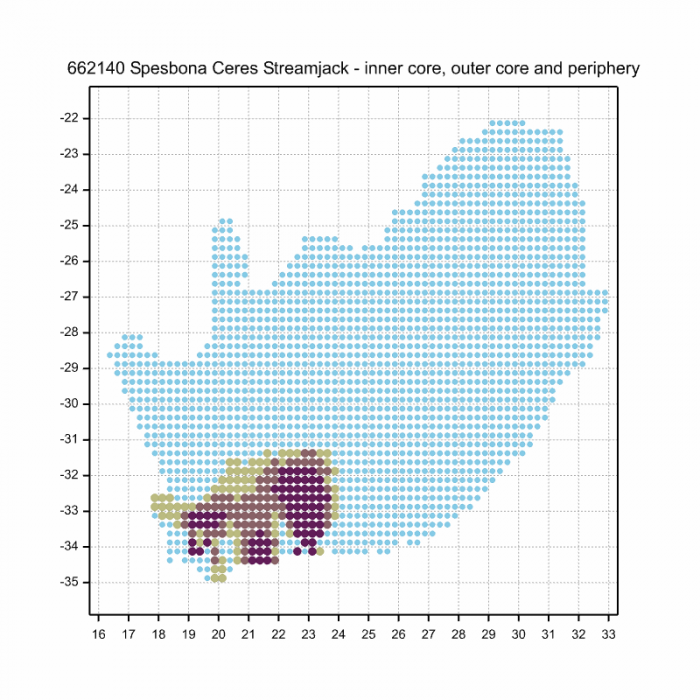
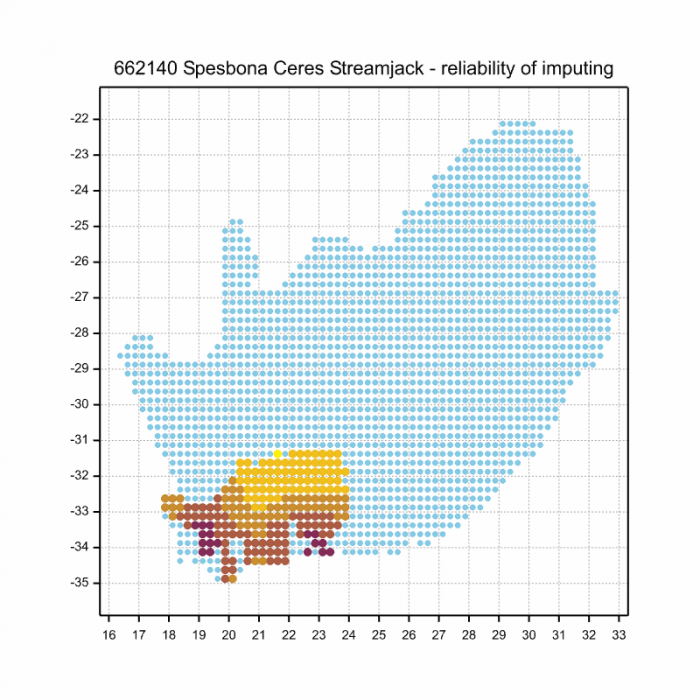
Ultimately, we will produce a series of maps for all the Odonata species in the region. The current algorithm is a new algorithm. The objective is mainly to produce “smoothed” maps that could go into a field guide for Odonata. This basic version of the algorithm (as mapped above) does not make use of “explanatory variables” (e.g. altitude, terrain roughness, presence of freshwater — we will be producing maps that take these variables into account soon). Currently, it only makes use of the OdonataMAP records for the species being mapped, as well as all the other records of all other species. The basic maps are “optimistic” and will generally show ranges to be larger than what they probably are.
These maps use the data in the OdonataMAP section of the Virtual Museum, and also the database assembled by the previous JRS funded project, which was led by Professor Michael Samways and Dr KD Dijkstra.
Phenology
Further Resources
The use of photographs by Desire Darling and Gregg Darling is acknowledged. All other photographs by Ryan Tippett.
Spesbona Spesbona angusta (Selys, 1863). This species was moved from the genus Metacnemis in 2013.
Other common names: Ceres Streamjack (Alt. English); Spesbona (Afrikaans)
Recommended citation format: Loftie-Eaton M; Navarro R; Tippett RM; Underhill L. 2025. Spesbona Spesbona angusta. Biodiversity and Development Institute. Available online at https://thebdi.org/2020/04/21/ceres-streamjack-spesbona-angusta/
References: Tarboton, M; Tarboton, W. (2019). A Guide to the Dragonflies & Damselflies of South Africa. Struik Nature.
Samways, MJ. (2008). Dragonflies and Damselflies of South Africa. Pensoft
Samways, MJ. (2016). Manual of Freshwater Assessment for South Africa: Dragonfly Biotic Index. Suricata 2. South African National Biodiversity Institute, Pretoria
